
Appearance
Legends
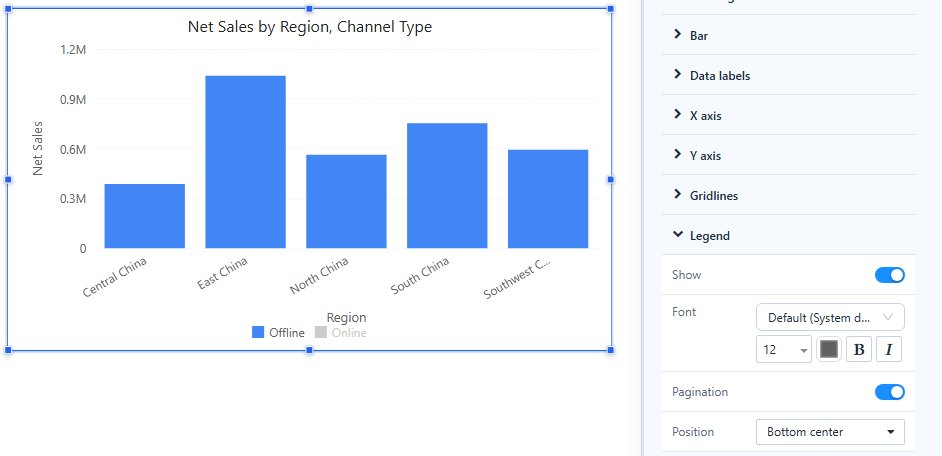
A legend names the series of a chart. Series come from the Legend field (for example Channel Type) or from several measures.
Reader actions
| Action | Result |
|---|---|
| Click an item | Hides or shows that series. |
| Double-click an item | Shows only that series. Double-click it again to show all. |
Value axes rescale to the series that remain, unless the axis has a fixed minimum or maximum. Stack totals are recalculated. Hidden series stay hidden when filters change or the chart is resized, but the report always opens with all series shown.
Settings
Select the chart and open Style → Legend:
| Setting | What it does |
|---|---|
| Show | Shows or hides the legend. |
| Font | Font, size and colour of the items. |
| Pagination | On (default): items that do not fit are paged with arrows. Off: the legend wraps onto several lines. |
| Position | Where the legend sits around the plot. |
On a pie chart, long legend names are shortened to fit and shown in full in the tooltip. If a wrapped legend would take more than half of the pie, it is paged instead.
Legend colours come from the page palette. Turn on Consistent member colors to give each member the same colour in every chart; see Colors and Color Schemes.
Related: Tooltips · Adding Components