
Appearance
Hierarchy Table Filter
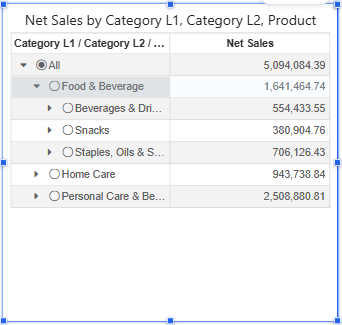
The Hierarchy table filter shows a hierarchy as an expandable tree, optionally with measure columns, and filters linked components by the node the reader selects, for example Food & Beverage › Snacks.
Set up
- Add Components → Filters → Hierarchy table filter.
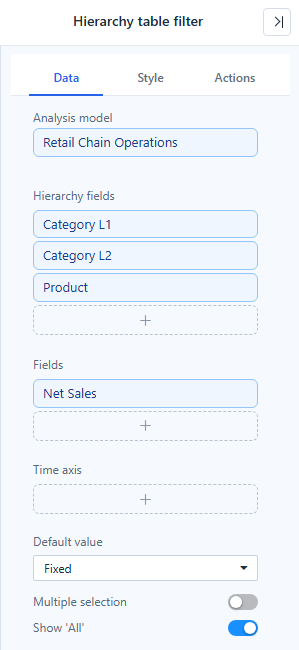
- In Data, put the levels in Hierarchy fields from top to bottom, for example Category L1, Category L2, Product.
- Optionally add measures to Fields; they are shown as columns next to the tree.
- Choose the Default value, Multiple selection and Show 'All'.
- In Actions → Interactions, check the Linked components.
The tree column header lists every level, joined with " / ": Category L1 / Category L2 / Product.
Long levels: Show more
When Style → Default expand level is None, the first level and each expanded node load 1,000 members at a time. A Show more (1,000 of 3,452 shown) row at the end loads the next batch. A parent whose children are not all loaded is not shown as fully selected. Exports are not limited.
Style
| Setting | Where | Notes |
|---|---|---|
| Show | Style → Header | Show or hide the header row. |
| Fit columns to width | Style → Grid | On for new filters: columns widen to fill the component; columns you resized keep their width. |
| Default expand level | Style | How many levels are expanded when the report opens. |
| Row height, fonts, colours | Style → Grid, Content | As in the Tree table. |
Reader actions
- Click a node to select it; click All to clear. Clear selections in the filter toolbar does the same.
- Reset filters on a Filter button and Refresh return to the default value.
- The Hierarchy table filter does not take values from the URL, and it has no Cascade other filters switch.
Related: Filters · Creating Hierarchies