
Appearance
Display Units and Decimal Places
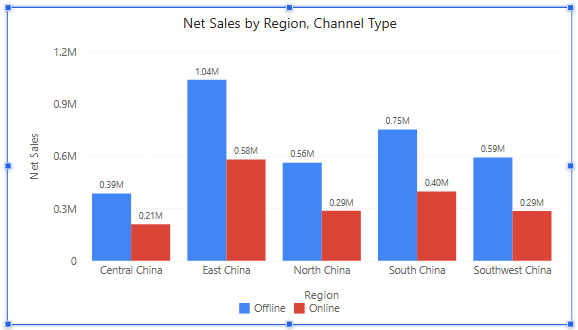
Display units and Decimal places change how a component writes its numbers, for example 1,037,979.98 as 1.04M, without changing the measure's format in the model or on other components. Tooltips keep showing the full formatted value.
Where to find them
| Component | Path |
|---|---|
| Column, bar, line, area, combo, pie, grouped donuts, funnel, treemap, Sankey and heat matrix charts | Style → Data labels |
| Box plot | Style → Outliers |
| Measure card | Style → Main value, Comparison #1 settings, Comparison #2 settings |
| Gauge | Style → Measure value, Target value, Scale axis |
| Filled map | Style → Data picker |
| Reference lines | Analytics → select the line → Label |
The KPI trend card has its own Unit and Decimal places under Style → Marker value. 100% charts, Waterfall, Scatter, Range column, Histogram, Bullet, Radar and tables have no display-unit setting; use the measure's Format instead.
Options
| Display units | Result |
|---|---|
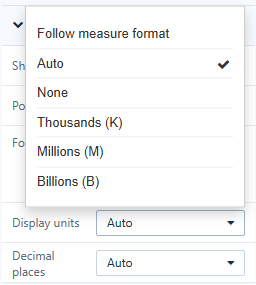
| Follow measure format | Writes the value exactly as the measure's format does. |
| Auto | Keeps a unit that the measure format already has (for example M from the model's display scale). Otherwise picks one from the size of the largest value: K from 1,000, M from 1,000,000, B from 1,000,000,000. |
| None | Full numbers, no unit. |
| Thousands (K), Millions (M), Billions (B) | Always that unit. |
Decimal places: Auto or 0–4. With Auto and a unit, data labels get about three significant digits (1.04M, 0.58M, 12.5K); cards, gauges and maps show up to two decimals. Without a unit, Auto uses the measure format's decimals.
Percentages are never scaled. Chinese and Japanese interfaces also offer 万, 百万 and 亿, and Auto uses 万 and 亿 there.
Data labels choose one unit per measure, so in a combo chart a quantity of 35 and sales of 2.5M are each written readably. All gauges in one component share a unit.
Defaults
- New charts, measure cards, gauges, filled maps and reference lines start with Auto. Exception: new Grouped donuts start with Follow measure format.
- Components in reports created before 10.00 keep Follow measure format, so they look as before.
- The KPI trend card unit starts with None.
Value axis units
Axes have a separate setting: Style → Y axis → Scale (on bar charts X axis → Scale; on combo charts Left axis unit and Right axis unit). Options: Auto (default), K, M, B, T, %.
With Auto, the unit follows the tick interval: an axis from 0 to 2 million with 500K steps reads 0, 0.5M, 1.0M, 1.5M, 2.0M. With a fixed unit every tick has the same number of decimals. A percent axis is used only when every measure on the axis is a percentage.
Display units or measure format?
| Use | When |
|---|---|
| Display units on the component | You want compact labels on one chart or card. |
| Format on the measure (Data → ⋮ → Format) | You need a prefix, suffix, a fixed number of decimals or the same look in tables. |
| Display scale in the model | Every report should show the measure in K, M or B by default. See Units and Display Scale. |
Related: Page Settings · Tooltips