
Appearance
Gauge
Show a value against a scale and an optional target. A gauge is useful when the scale has a meaningful business range, such as capacity utilization. For several category comparisons, a Bullet chart usually uses space more efficiently.
Build a performance gauge
- Add Components → Charts → Cards & KPI → Gauge (a new gauge is 320 × 240 px) and select an Analysis model in Data.
- Bind Measure to the actual metric.
- Define the scale and target, either with measures or with fixed numbers (see below).
- Add Series only when you need one gauge per category, for example Region.
- Apply Filters so the actual, bounds and target describe the same population and period.
| Field group | Holds |
|---|---|
| Series | Optional dimension: one gauge per member. |
| Measure | The actual value (pointer and centre value). |
| Minimum value, Maximum value, Target | Optional measures for the scale ends and the target, for example a capacity measure. The automatic title leaves them out. |
| Time axis | Optional date field for a page Date filter that filters by time axis. |
| Filters | Component filters. |
A target and a scale maximum are different concepts: a target can be 80 while the capacity scale extends to 100. For percentage measures, use the stored units throughout, for example 0.8 and 1 for a rate stored as a decimal.
Set the scale and target
Fixed numbers go in the Style tab: Scale axis → Minimum value and Maximum value, and Target value → Target. Each value is taken from the first available source:
| Value | 1st | 2nd | 3rd |
|---|---|---|---|
| Minimum, maximum (each end separately) | Measure in Data | Number in Style → Scale axis | Automatic |
| Target | Measure in Data → Target | Number in Style → Target value → Target | None |
You can fix one end and leave the other automatic. Range ends are rounded: to two decimals when the span is below 1, to one decimal below 5, otherwise to whole numbers. A saved 0 stays 0.
If you set a minimum or maximum (as a number or a measure) and the maximum is not greater than the minimum, the gauge is not drawn and the component shows The maximum value must be greater than the minimum value. An automatic range never shows this message.
Automatic range
An end you do not set is calculated once for all gauges in the component:
| Data | Range |
|---|---|
| Positive values | 0 to the larger of (largest actual × 2) and (largest target × 1.1), rounded up to 1, 1.2, 1.5, 2, 2.5, 3, 4, 5, 6, 8 or 10 × a power of ten. An actual of 707,090 without a target gives 0–1,500,000. |
| Percentage measure, all values and targets between 0 and 1 | 0–100% |
| Negative values | Minimum = −(2 × the absolute smallest value), rounded; maximum as above, or 0 if no value is positive. |
| All values 0, or no numbers | 0–1 |
Because targets are included, the target always lands on the arc. Without a target and without a maximum, the pointer usually sits near the middle of the arc. Set Maximum value when the scale has a business meaning, and give several gauges the same range when readers compare them: gauges on different scales cannot be compared by pointer angle. A value outside a fixed range is a reason to check the data and the chosen scale, not automatically to extend the maximum.
How the target is drawn
- A short line crosses the arc at the target, in the colour of Target value → Target value color.
- The target value is written just outside the arc at the target's angle. If there is not enough room, all gauges shrink by up to 15%; if that is still not enough, the label moves inside the arc.
- A target outside the range is drawn at the end of the arc as a faded line, and its label gets › (above the maximum) or ‹ (below the minimum).
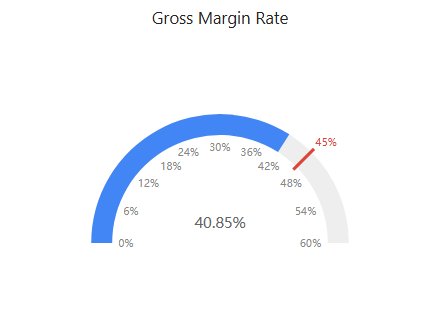
- A typed target is written in the main value's format: next to 40.97%, a target of 0.3 shows as 30.00%.
- The label is always shown when there is a target.
Format the gauge
| Style group | Options | Defaults |
|---|---|---|
| Theme | Default theme, Basic theme, Theme A. The Default theme semicircle is centred vertically in each gauge's area. | Default theme |
| Position | Horizontal and Vertical offset (−30 to 50%), Size (90–300%). | 0, 0, 100% |
| Series | Show the series name, Font. | – |
| Measure value | Show, Pointer color, Font, Display units, Decimal places. | – |
| Target value | Target (fixed number), Target value color (font and marker colour), Display units, Decimal places. | – |
| Scale axis | Minimum value, Maximum value, Axis color, Tick marks, Minor tick marks, Tick mark label, Font, Display units, Decimal places. | Tick marks and Minor tick marks off; Tick mark label on for new gauges, off in older reports |
Display units and Decimal places in the three groups format the centre value, the target (label and tooltip) and the tick labels. New gauges start with Display units = Auto in all three; gauges in older reports keep Follow measure format. Decimal places is Auto or 0–4. With Auto, a unit already set in the measure format is kept; otherwise all gauges in the component share one unit chosen from the largest value, and the target and ticks share one unit chosen from the range. Percentages are never scaled. See Display units and decimal places.
Tick labels on a percentage measure read 20%, 40%… When neighbouring tick labels would overlap at the current size, the scale uses fewer segments (10, then 5, 4, 2 or 1). Labels can still touch the centre value, or a target label that was moved inside the arc, in very small gauges.
Tooltip
Hovering a gauge shows the measure, then:
| Row | Content |
|---|---|
| Target | The typed or bound target, with "(out of range)" when it lies outside the scale. |
| Achievement | Actual ÷ target, as a percentage with one decimal. Omitted when the target is 0. |
| Difference | Actual − target with a + or − sign, formatted like the target. |
Bound Minimum value and Maximum value measures also appear. See Tooltips.
Empty data
When no gauge has a number, for example because the filters exclude everything, the component shows the empty-data message instead of an empty 0–1 gauge. A gauge with the value 0 is drawn normally. See Empty data and errors.
Opening reports made before 10.00
- Gauges without a set range use the new automatic range, so their pointer position and fill change.
- The target is redrawn as a line across the arc with the label outside it.