
Appearance
Use Aggregation Tables
Aggregation tables are used to improve query performance in Datafor.
Instead of aggregating data from the detail fact table every time a report runs, Datafor can use a pre-aggregated table when the report query matches the granularity and metric definitions of that table. This can reduce scanned data volume, shorten SQL execution time, and improve dashboard responsiveness.
What is an aggregation table
A fact table usually stores data at the lowest business granularity, such as one row per transaction or one row per sales record.
However, many reports do not need that level of detail. For example, users often analyze:
- sales by year
- sales by quarter
- sales by store
- sales by product category
If these queries are frequent and the fact table is large, repeatedly aggregating detail data can become expensive.
An aggregation table stores pre-calculated results at a higher level of granularity, such as:
- by store and year
- by store and quarter
- by product and month
- by region and year
When a report query is compatible with the aggregation table, Datafor can use that table instead of the detail fact table.
Benefits of aggregation tables
Aggregation tables are mainly used for performance optimization.
Typical benefits include:
- faster report execution
- lower SQL cost
- less database load
- better user experience for dashboards and charts
- better performance for large fact tables
Aggregation tables are not a replacement for detail tables. They are an optimization layer for common analysis patterns.
When to use aggregation tables
Aggregation tables are recommended when:
- the fact table contains a large amount of data
- users frequently run similar summary queries
- dashboards repeatedly use the same dimensions and measures
- report response time needs to be improved
- the analysis granularity is relatively stable
For example, aggregation tables are especially useful when users often analyze:
- sales by month, quarter, or year
- sales by store
- sales by product
- cost by region
- unit sales by time period
Before you begin
Before configuring an aggregation table in Datafor, make sure the following are ready:
1. The aggregation table already exists in the database
Datafor maps an existing aggregation table to the detail model. It does not create the aggregation table automatically.
Examples:
agg_sales_store_monthagg_sales_region_quarteragg_product_yearagg_c_special_sales_fact_1997
2. The granularity of the aggregation table is clear
You should know exactly what the table is grouped by.
Examples:
- store + year + quarter
- product + month
- region + year
This is important because only compatible queries can use the aggregation table.
3. The measures are clearly defined
You should know how each aggregated measure in the table was calculated.
Examples:
store_sales_sum=SUM(store_sales)unit_sales_sum=SUM(unit_sales)fact_count= number of detail rows rolled into the aggregated row
Open the aggregation configuration
In the modeling canvas, select a table, open the table menu, and click Manage aggregations.
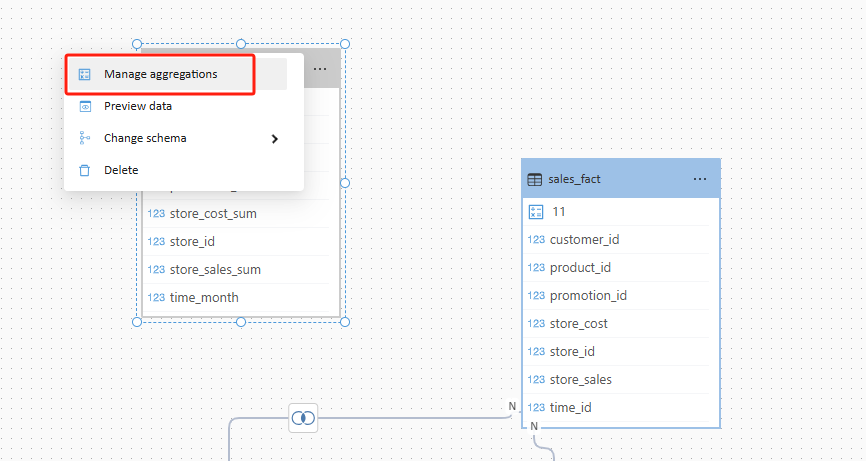
The Manage aggregations dialog is used to map aggregation table columns to fields in the detail model.
Fields in the Manage aggregations dialog
The dialog contains the following columns:
| Column | Description |
|---|---|
| Aggregation column | A column in the aggregation table |
| Summarization | The aggregation behavior that explains how this aggregation column is derived from the detail model |
| Detail table | The table in the detail model that the aggregation column maps to |
| Detail column | The field in the detail table that the aggregation column maps to |
Each row defines one mapping between the aggregation table and the detail model.
How to configure an aggregation table
For each aggregation table column, choose the correct summarization method and map it to the corresponding detail field.
Example
Suppose the aggregation table is grouped by:
store_idtime_yeartime_quarter
And it stores the following aggregated measures:
store_sales_sumunit_sales_sum
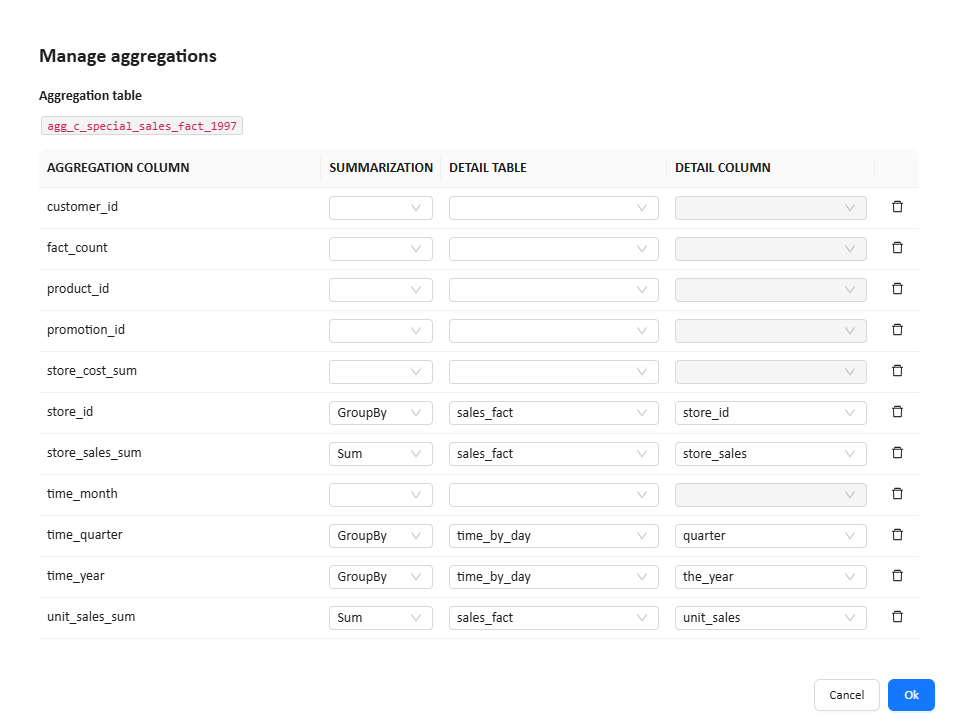
A typical configuration would be:
| Aggregation column | Summarization | Detail table | Detail column |
|---|---|---|---|
store_id | GroupBy | sales_fact | store_id |
time_year | GroupBy | time_by_day | the_year |
time_quarter | GroupBy | time_by_day | quarter |
store_sales_sum | Sum | sales_fact | store_sales |
unit_sales_sum | Sum | sales_fact | unit_sales |
This tells Datafor that:
store_id,time_year, andtime_quarterdefine the grouping levelstore_sales_sumis the sum ofsales_fact.store_salesunit_sales_sumis the sum ofsales_fact.unit_sales
Summarization methods
The Summarization field tells Datafor how an aggregation table column was derived from the detail model.
The available options are:
GroupBySumCountMaxMinCount table
Choosing the correct summarization method is critical. If it is wrong, Datafor may not use the aggregation table, or the query result may be incorrect.
GroupBy
Use GroupBy when the aggregation column is a grouping key, not a calculated metric.
Typical examples:
store_idproduct_idcustomer_idtime_yeartime_quartertime_monthregion_id
Example:
| Aggregation column | Summarization | Detail table | Detail column |
|---|---|---|---|
store_id | GroupBy | sales_fact | store_id |
time_quarter | GroupBy | time_by_day | quarter |
Choose GroupBy when the column represents a dimension that defines the aggregation grain.
Sum
Use Sum when the aggregation column stores the result of SUM() on a detail field.
Typical examples:
- sales amount
- cost amount
- quantity
- unit sales
Example:
| Aggregation column | Summarization | Detail table | Detail column |
|---|---|---|---|
store_sales_sum | Sum | sales_fact | store_sales |
unit_sales_sum | Sum | sales_fact | unit_sales |
store_cost_sum | Sum | sales_fact | store_cost |
Choose Sum when the metric is additive and can be safely rolled up across higher levels.
Count
Use Count when the aggregation column stores the result of COUNT() for a detail field.
Typical examples:
- order count
- customer count
- number of non-null values in a field
Example:
| Aggregation column | Summarization | Detail table | Detail column |
|---|---|---|---|
order_count | Count | sales_fact | order_id |
Choose Count when the metric is the count of a specific field.
Max
Use Max when the aggregation column stores the result of MAX() for a detail field.
Typical examples:
- highest price
- latest date
- maximum discount
Example:
| Aggregation column | Summarization | Detail table | Detail column |
|---|---|---|---|
max_price | Max | sales_fact | unit_price |
Choose Max when the metric represents the maximum value at the aggregation grain.
Min
Use Min when the aggregation column stores the result of MIN() for a detail field.
Typical examples:
- lowest price
- earliest date
- minimum inventory value
Example:
| Aggregation column | Summarization | Detail table | Detail column |
|---|---|---|---|
min_price | Min | sales_fact | unit_price |
Choose Min when the metric represents the minimum value at the aggregation grain.
Count table
Use Count table when the aggregation column stores the number of detail fact rows represented by the aggregated row.
Typical examples:
fact_countrow_countrecord_count
This is commonly used when the aggregation table stores how many fact table rows were rolled up into each aggregate row.
Example:
| Aggregation column | Summarization | Detail table | Detail column |
|---|---|---|---|
fact_count | Count table | sales_fact |
Choose Count table when the column represents the count of underlying fact rows rather than the count of one specific detail field.
If you are not sure whether a count-related column should use
CountorCount table, first confirm the exact meaning of that column in the database.
How to choose the correct summarization method
A simple way to choose is to ask:
Is this column a grouping key, or is it a calculated aggregate result?
Choose GroupBy for dimension keys
If the column defines the aggregation grain, use GroupBy.
Examples:
store_idproduct_idcustomer_idtime_yeartime_quartertime_month
Choose Sum for additive metrics
If the column stores a total amount or total quantity, use Sum.
Examples:
store_sales_sumunit_sales_sumstore_cost_sum
Choose Count or Count table for count metrics
If the column stores a count:
- use
Countwhen it counts a specific field - use
Count tablewhen it counts fact table rows
Examples:
| Aggregation column | Recommended summarization |
|---|---|
order_count | Count |
customer_count | Count |
fact_count | Count table |
Choose Max or Min for extreme values
If the column stores a highest or lowest value, use Max or Min.
Examples:
| Aggregation column | Recommended summarization |
|---|---|
max_discount | Max |
min_price | Min |
Quick selection guide
You can use the following rule of thumb:
- dimension field ->
GroupBy - additive metric ->
Sum - count metric ->
CountorCount table - highest value ->
Max - lowest value ->
Min
Example based on the current aggregation table
For the aggregation table shown in the example, a reasonable configuration would be:
| Aggregation column | Recommended summarization | Notes |
|---|---|---|
store_id | GroupBy | grouped by store |
time_year | GroupBy | grouped by year |
time_quarter | GroupBy | grouped by quarter |
time_month | GroupBy if month is part of the aggregation grain | otherwise leave unmapped |
store_sales_sum | Sum | total store sales |
unit_sales_sum | Sum | total unit sales |
store_cost_sum | Sum | total store cost |
fact_count | Count table or Count | depends on the actual meaning of the column |
customer_id | GroupBy only if customer is part of the aggregation grain | otherwise leave unmapped |
product_id | GroupBy only if product is part of the aggregation grain | otherwise leave unmapped |
promotion_id | GroupBy only if promotion is part of the aggregation grain | otherwise leave unmapped |
How Datafor decides whether to use an aggregation table
After the aggregation table is configured, Datafor will only use it when the report query is compatible with the table.
In general, the following conditions must be satisfied.
1. The query grain must be compatible
The report query cannot require a finer grain than the aggregation table.
Example:
- aggregation table grain: store + year + quarter
- report query grain: store + month
Because month is more detailed than quarter, the query usually cannot use that aggregation table.
2. The requested measures must be compatible
The measures in the report must match the summarized metrics supported by the aggregation table.
For example, a table that only stores SUM(store_sales) cannot automatically answer every possible metric request, such as:
- distinct customer count
- average basket size
- ratio metrics
- complex calculated measures
3. Filters must be compatible
If the query uses filters that are not safely supported by the aggregation table grain, Datafor may fall back to the detail table.
Verify whether a report query uses the aggregation table
After configuration, the best way to confirm whether the aggregation table is being used is to inspect the SQL in the report editor.
In the report editor, select a chart, open the chart menu, and click Execution cost.
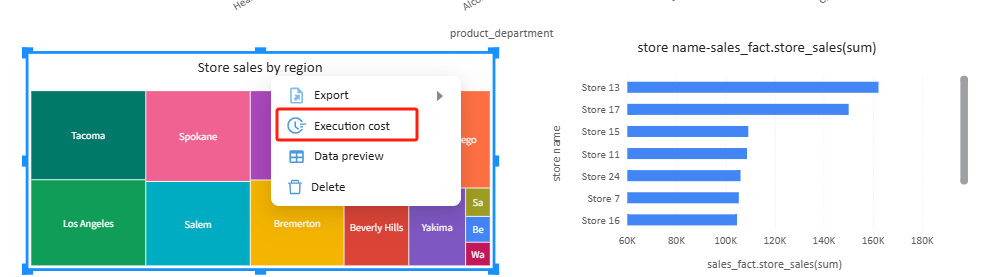
The Execution cost dialog shows the generated SQL and execution time.
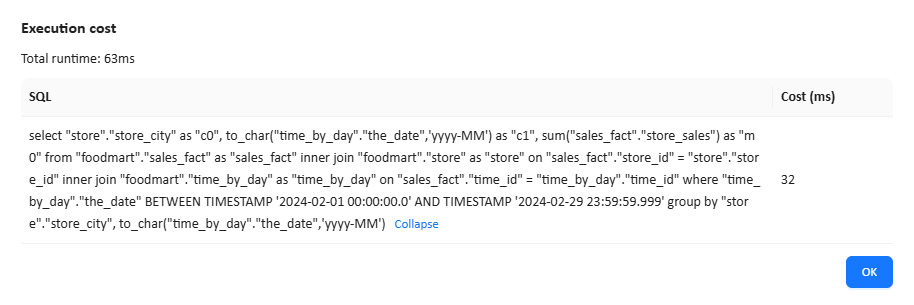
What to check in the SQL
Look at the actual table names used in the SQL.
- If the SQL reads from the aggregation table, such as
agg_c_special_sales_fact_1997, the aggregation table was used. - If the SQL still reads from the detail fact table, such as
sales_fact, the aggregation table was not used for that query.
Example of a query not using the aggregation table
If the SQL still uses:
sales_facttime_by_daystore
instead of the aggregation table, the query did not match the aggregation table.
A common reason is grain mismatch.
For example:
- the aggregation table is grouped by year and quarter
- the SQL groups by month, such as
to_char(the_date, 'yyyy-MM')
Since month is more detailed than quarter, the query usually has to fall back to the detail table.
This is an important point:
Configuring an aggregation table does not mean every report will automatically use it. The query must match the table grain and measure definitions.
Best practices
Start with high-frequency slow queries
Do not build many aggregation tables at once. Start with the most common slow queries and optimize those first.
Make the grain explicit
Use clear table names that reflect the grain.
Examples:
agg_sales_store_monthagg_sales_region_quarteragg_sales_product_year
Keep the measure meaning consistent
The aggregation table measure must match the semantic meaning used in reports.
Validate with SQL
Always verify configuration results in the report editor by checking the SQL and execution time.
Do not optimize only very coarse grains
If users often analyze data by month, a yearly aggregation table may provide limited benefit.
Keep the aggregation table refreshed
If the detail fact table changes but the aggregation table is not updated in time, report results may become inconsistent.
Design recommendations
Design by time grain
Create separate aggregation tables for:
- month
- quarter
- year
This is useful when time-based analysis is common.
Design by subject area
Create aggregation tables for frequent analysis subjects, such as:
- by store
- by product
- by region
Design by dashboard use case
For important dashboards, build aggregation tables that specifically match the chart patterns used there.
This is often the most practical strategy.
Special note on average, ratio, and distinct count
Some metrics are not safe to accelerate by storing only one final value.
Examples:
- average
- percentage
- ratio
- distinct count
- complex calculated measures
These usually require additional design.
For example:
- average may require both
sumandcount - ratio may require numerator and denominator
- distinct count usually cannot be safely re-aggregated by simple addition
For this reason, aggregation tables are most effective when they focus first on:
GroupBySumCountMaxMin
Troubleshooting
The aggregation table is configured, but the report still queries the detail fact table
Possible reasons include:
- the report grain is more detailed than the aggregation table
- the report uses dimensions not covered by the aggregation table
- the metric mapping is incorrect
- the summarization method is incorrect
- the report uses unsupported filters
- the aggregation table data is incomplete or outdated
The report result is incorrect after using the aggregation table
Possible reasons include:
- the aggregation table measure does not match the intended business metric
- the summarization method was selected incorrectly
- the aggregation grain is inconsistent with the report design
- the aggregation table data is out of sync with the detail table
I am not sure whether to use Count or Count table
Check the meaning of the aggregation table column in the database.
- If it counts a specific field, use
Count - If it counts fact rows rolled into the aggregate row, use
Count table
FAQ
Can one model use multiple aggregation tables
Yes. Different aggregation tables can serve different query patterns, grains, and dashboards.
Can an aggregation table replace the detail fact table
No. Aggregation tables are used for performance optimization. Detail tables are still needed for detailed analysis and queries that do not match the aggregation table grain.
How do I know whether performance actually improved
Compare the following before and after configuration:
- the generated SQL
- the execution time shown in Execution cost
- the report or dashboard response time
What happens if the summarization method is selected incorrectly
The query may not use the aggregation table, or the query result may be incorrect.
Summary
Aggregation tables in Datafor improve query performance by mapping pre-aggregated data to the detail model.
To use them effectively, focus on three things:
- design the right aggregation grain
- map dimensions and measures correctly
- verify the generated SQL in the report editor
If these are done correctly, aggregation tables can significantly improve report performance on large datasets.