
Appearance
Relative Date Filtering
Scenario Overview
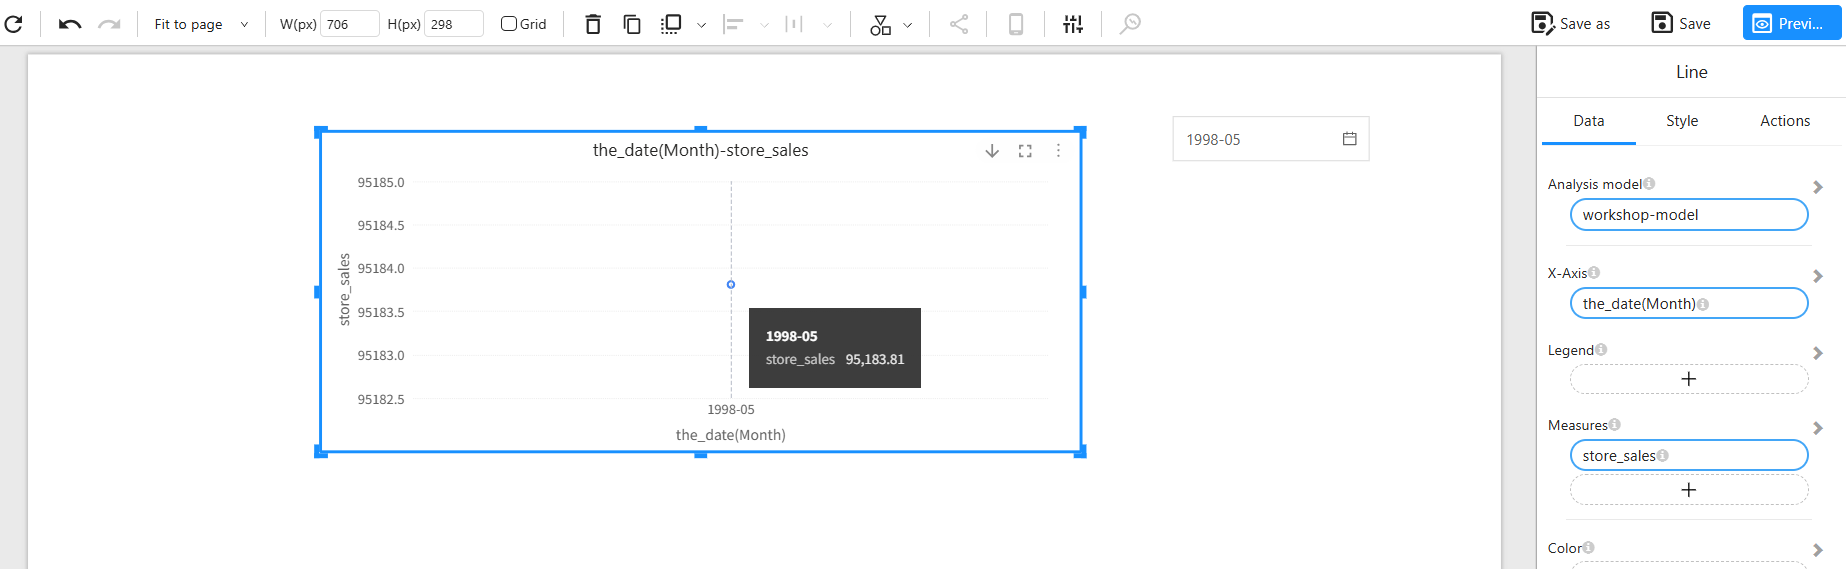
In a dashboard, when you select a specific month using a time filter component (e.g., May 1998), charts subscribed to that filter typically only display data for the selected month. For example, once May 1998 is selected, the line chart will only show data for May 1998. This is the default behavior: the time filter directly affects the subscribed charts.
However, when analyzing trends, it is often more useful to display a broader time range leading up to the selected date. For example, if May 1998 is selected, you may want the line chart to show data for the previous 12 months (from June 1997 to May 1998). Similarly, if the time filter is set to March 1998, the line chart should display data from April 1997 to March 1998.
To achieve this, you can enable Relative Date Filtering, which calculates a relative time range based on a specified Reference Time.
Example: By default, the time filter affects the line chart as shown below, limiting it to the selected month, which is not suitable for trend analysis.
Configuration Steps
Relative date filtering involves two main settings: defining the Reference Time and configuring the Relative Time Condition.
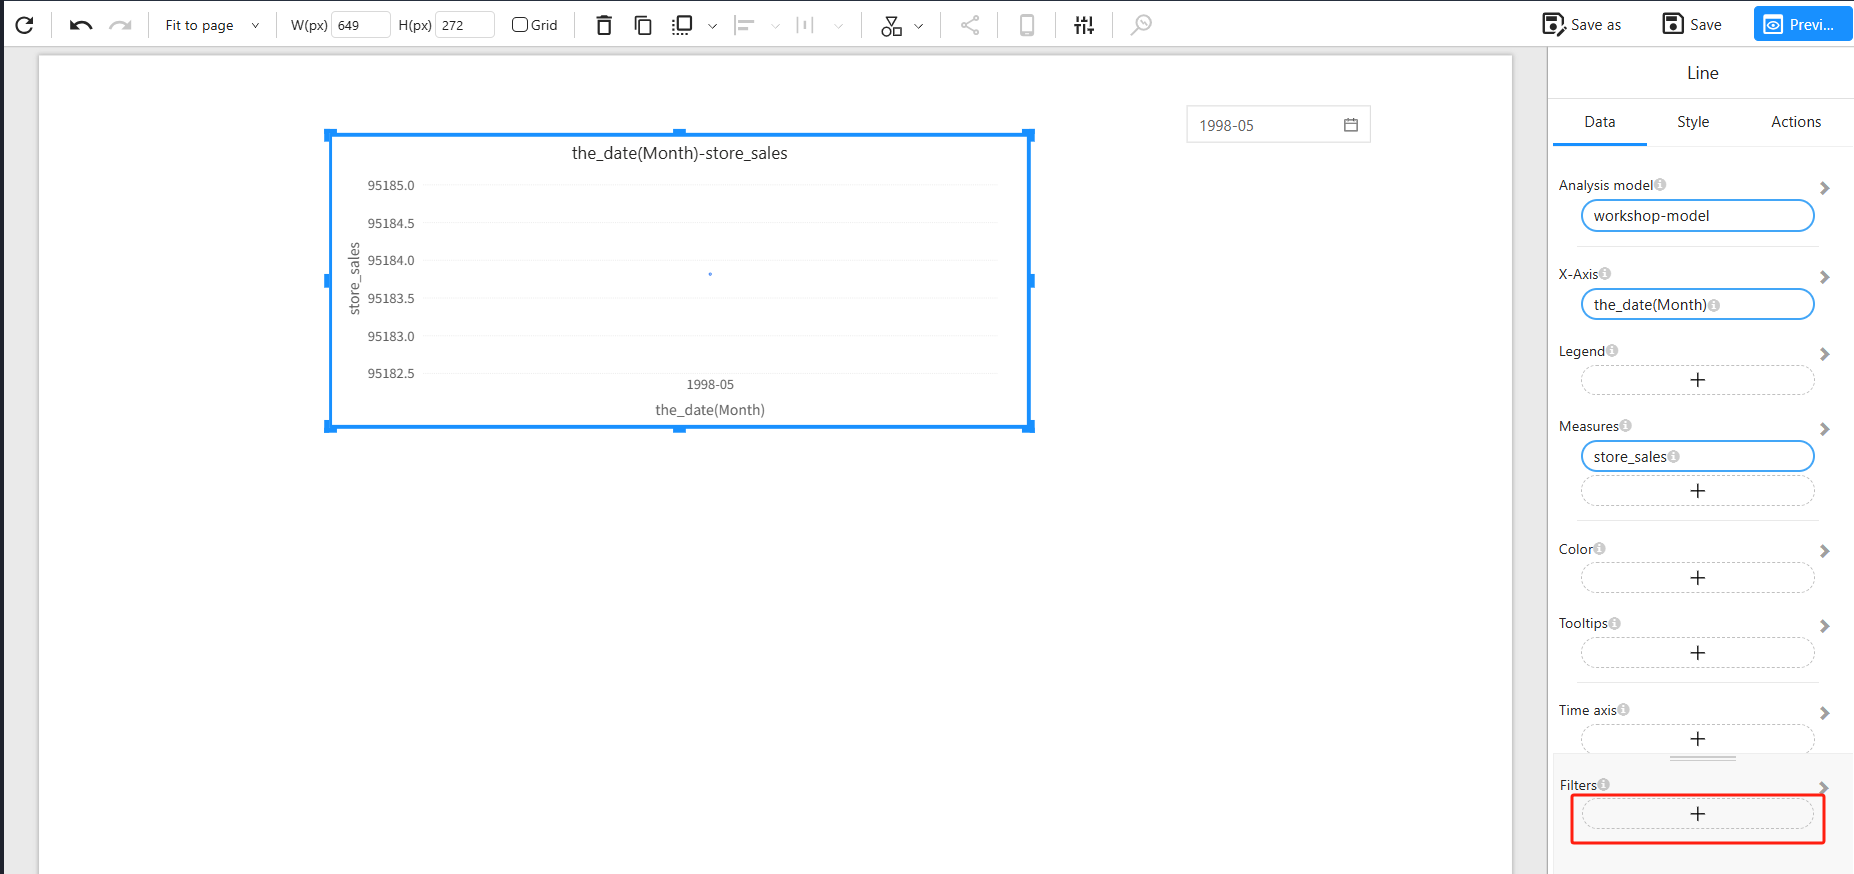
1. Configure a Time Filter in the Chart’s Filters Area
Note: The time field can either be the same as the time filter component on the dashboard or a more granular time field.
2. Set the Filter Type to “Relative”
In the filter component’s settings panel, set the Filter type to Relative. This enables the use of a Reference Time and a Relative Time Condition to dynamically calculate a date range.
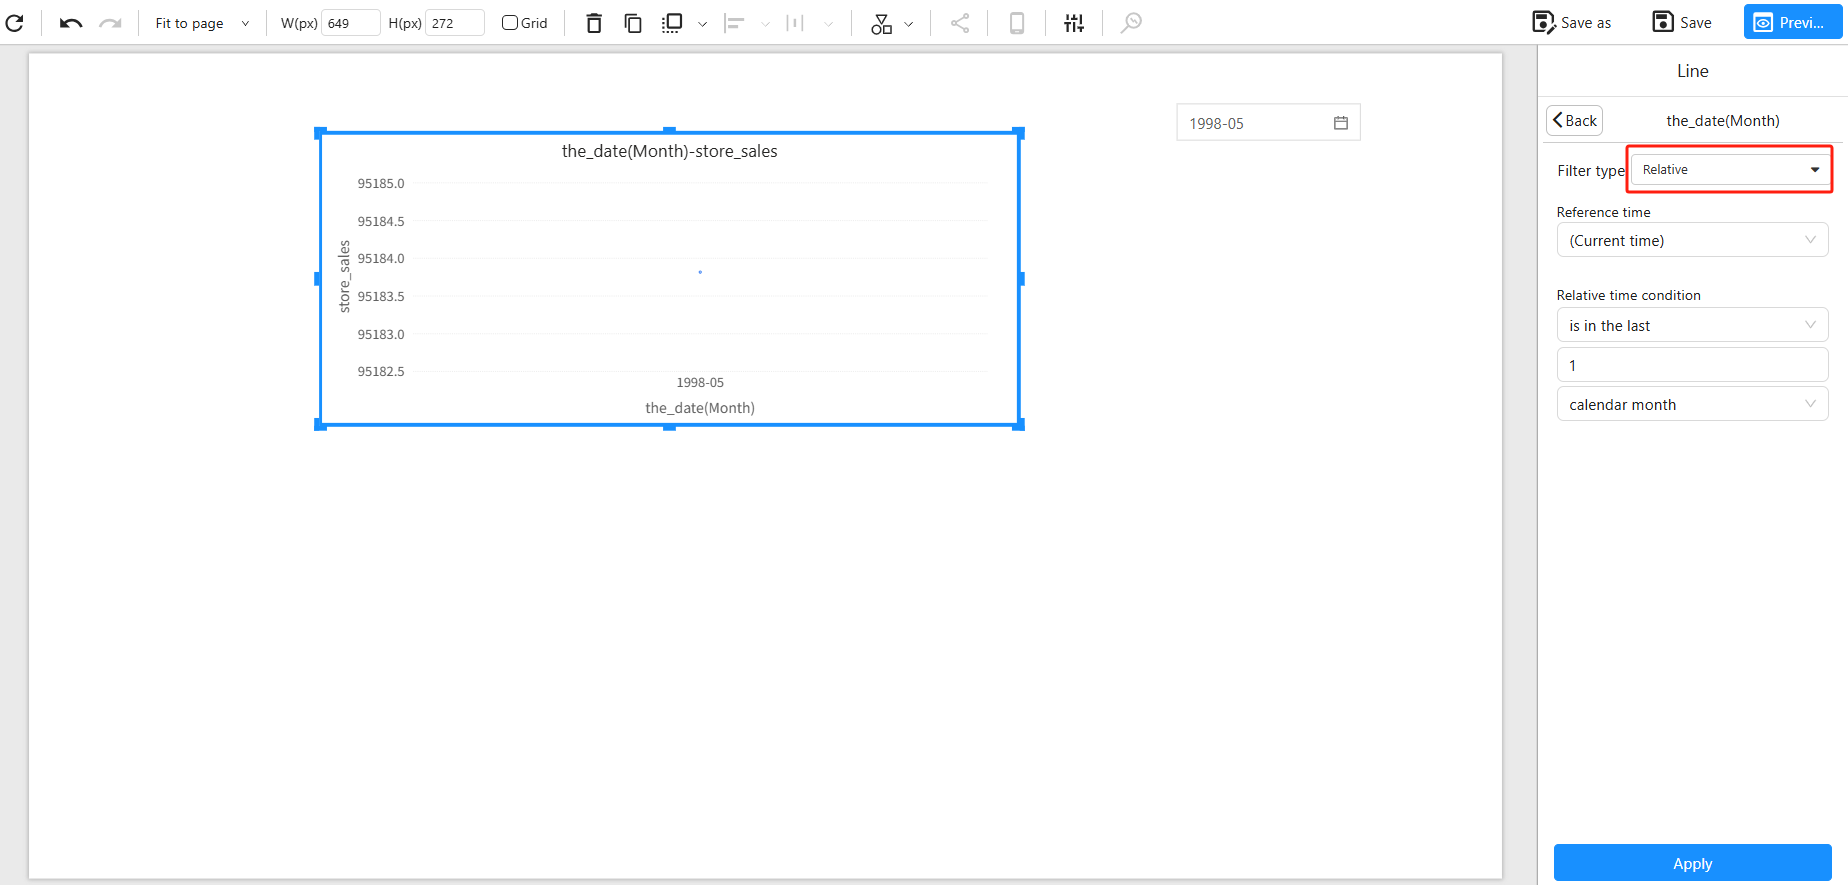
3. Choose a Reference Time
Relative date filtering requires a base point, known as the Reference Time. By default, this is set to Current time, meaning the relative range is calculated based on the current system time.
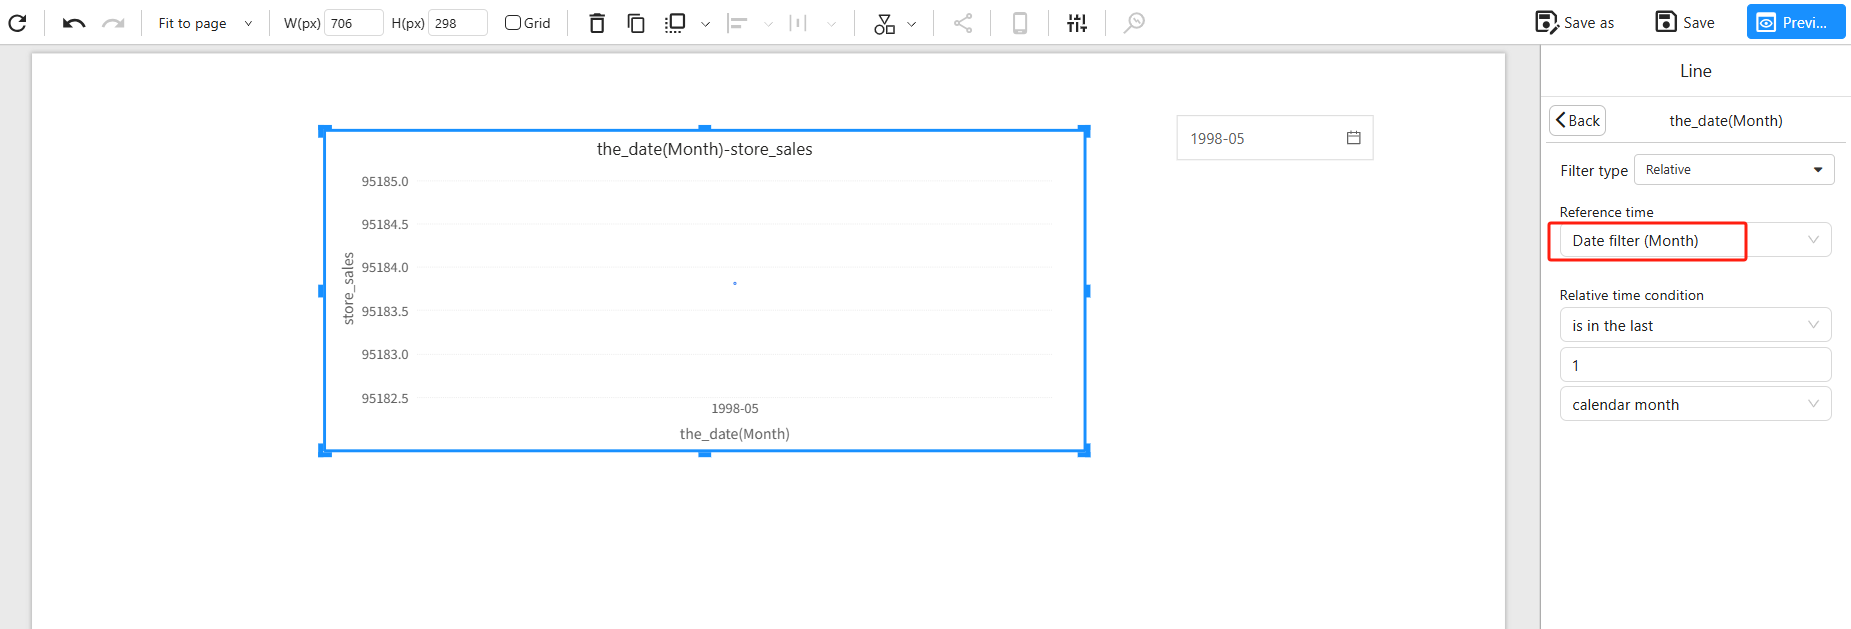
To base the relative range on the user's selection in the dashboard’s time filter (or time axis component), set the Reference Time to that filter component. This ensures the chart will use the selected time as the base for calculating the relative time range.
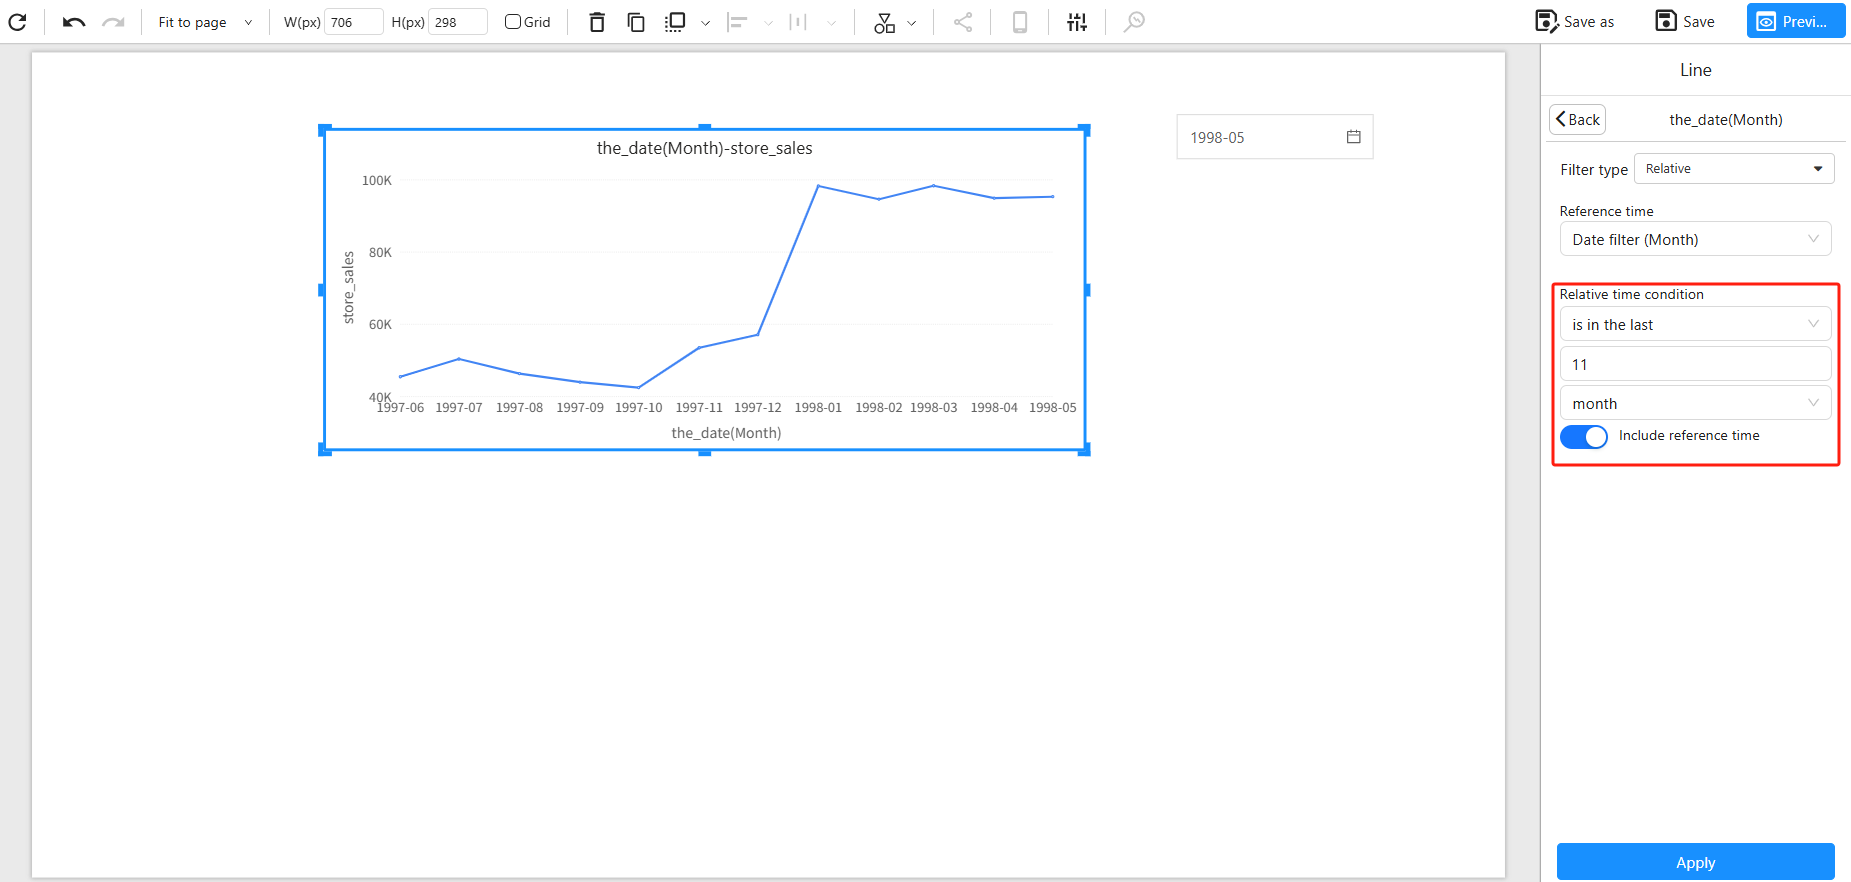
4. Set the Relative Time Condition
Finally, configure the Relative Time Condition to define the desired range. For instance, to show a 12-month trend ending with the selected month, set the start offset to -11 (including the current month) and set the duration to 12 months.
Once configured, selecting May 1998 in the time filter will make the line chart show data from June 1997 to May 1998. Selecting March 1998 will show data from April 1997 to March 1998.
Summary
Relative Date Filtering allows dashboards to flexibly define dynamic time windows, enabling trend and cumulative analyses. When your business scenario requires showing a rolling time window (e.g., the past 12 months) based on the user’s selection, configure the reference time and relative time condition accordingly. This way, selecting a specific month while viewing data for several months leading up to it becomes possible, enhancing the dashboard’s interactivity and analytical power.