
Appearance
Pivot Table
Overview
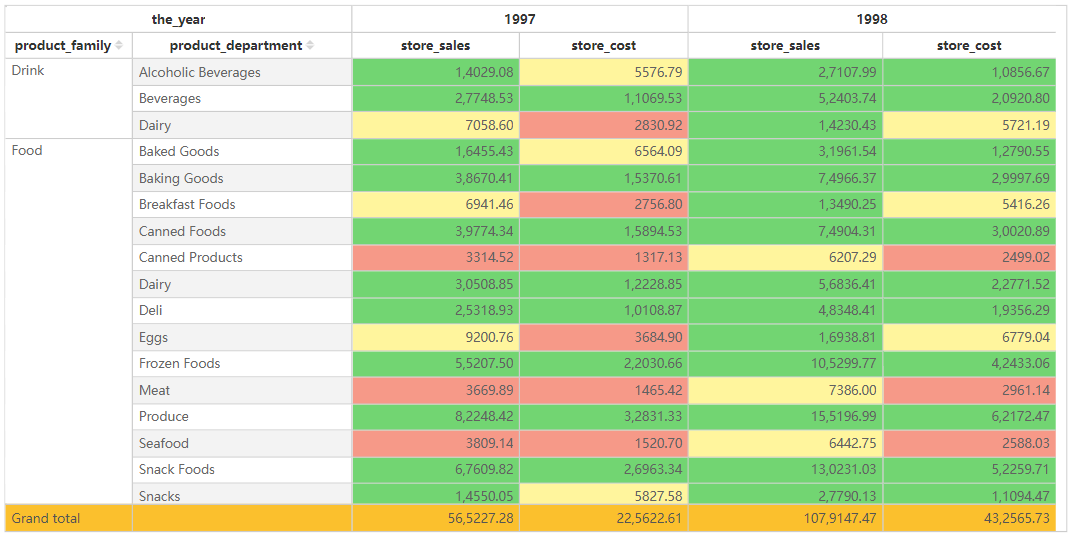
The Pivot Table is designed to display multi-dimensional data in a structured, hierarchical format. It enables dynamic aggregation and analysis of data across multiple dimensions, making it a powerful tool for financial reports, sales analysis, and business intelligence applications.
Key Features
- Hierarchical Data Representation: Supports row and column hierarchies for multi-level data analysis.
- Dynamic Aggregation: Summarizes data based on selected dimensions and measures.
- Sorting: Allows sorting data within each row and column level.
- Filtering: Users can apply filters via the filter pane or slicers to refine displayed data.
- Conditional Formatting: Enables the application of color mappings, data bars, and icon sets for better insights.
- Grand Totals & Subtotals: Provides automatic calculations at different hierarchical levels.
- Expandable & Collapsible Groups: Users can drill down or collapse levels for better navigation.
- Interactivity: Supports interaction with other visual components for cross-filtering and highlighting.
Configuring the Pivot Table Component
1. Field Configuration
- Rows: Add fields to define row hierarchies.
- Columns: Add fields to define column categories.
- Measures: Add numeric values to be aggregated in the pivot table.
- Time Axis (Optional): Apply a time-based dimension for trend analysis.
2. Style Settings
Title
- Display: Toggle visibility of the title.
- Content: Enter the pivot table title.
- Alignment: Set left, center, or right alignment.
- Font Settings:
- Font Family: Select the font type.
- Font Size: Customize the font size.
- Font Style: Bold (B), Italic (I), Underline (U).
- Background: Set the title background color.
Effects
- Background Color: Customize the overall background color of the pivot table.
- Borders:
- Border Width: Adjust border thickness.
- Border Style: Choose from solid, dashed, etc.
- Rounded Corners: Adjust table corner radius.
- Shadow: Apply outer shadow effects.
Grid
- Grid Lines: Toggle visibility of grid lines and customize colors.
- Alternating Row Colors:
- Odd Row Background: Set background color for odd rows.
- Even Row Background: Set background color for even rows.
- Hover Effects:
- Enable Hover: Highlight rows when hovered.
- Hover Background Color: Set hover effect color.
- Row Height: Customize row height in pixels.
Header
- Header Alignment: Set alignment of column headers.
- Background Color: Customize the header background.
- Font Settings:
- Font Family, Size, and Style (bold, italic, underline).
- Word Wrap: Enable automatic text wrapping for headers.
Content
- Font Settings: Configure font type, size, and style for data values.
- Word Wrap: Enable automatic text wrapping within cells.
- Column Alignment: Individually set alignment for each column.
- Row Numbering: Toggle row number visibility.
- Merge Cells: Enable merging of identical values across rows.
Subtotals
- Display Subtotals: Choose whether to show or hide subtotal rows.
- Position: Configure subtotals at the top or bottom of groups.
- Background Color: Customize subtotal row backgrounds.
Grand Total
- Show Grand Total: Toggle the display of the total row.
- Caption: Customize the text displayed for the grand total row.
- Background Color: Set the background color for the grand total.
- Font Settings: Configure the font style for total values.
Toolbar
- Display Mode:
- Always Visible
- Show on Hover
- Hidden
- Toolbar Color: Customize toolbar color.
- Extended Background: Expand toolbar background settings.
Pivot Table vs. Standard Table
| Feature | Pivot Table | Table |
|---|---|---|
| Data Hierarchy | ✅ Supported | ❌ Not Supported |
| Subtotal | ✅ Supported | ❌ Not Supported |
| Grand Totals | ✅ Supported | ✅ Supported |
| Cross Aggregation | ✅ Supported | ❌ Not Supported |
| Conditional Formatting | ✅ Supported | ✅ Supported |
Use Cases
- Displaying hierarchical data structures such as sales performance by region and year.
- Analyzing financial summaries with totals and subtotals.
- Creating interactive pivot reports that allow users to drill down into data.
- Comparing multiple categories and summarizing numerical values dynamically.