
Appearance
Line
Overview
A Line Chart is used to visualize trends over time by connecting data points with lines. It is useful for showing changes, patterns, and relationships across different time periods.
When to Use
- To analyze trends over time (e.g., sales over months).
- To compare multiple series of data over the same time period.
- To detect seasonal patterns or variations in data.
Data Structure
A Line Chart requires:
- X-Axis: A time-based dimension (e.g.,
the_date(Month)). - Measures: One or more numerical fields representing the trend data (e.g.,
store_sales,store_invoice,store_cost). - Legend (Optional): A categorical field that differentiates the lines (e.g.,
store_type). - Color(Optional): Used to set the color of the chart based on categories or numerical values (intensity-based coloring, or using a categorical field for distinct colors).
- Tooltips(Optional): Show additional details when hovering over plot area.
- Filters (Optional): Used to refine the displayed data (e.g., filtering by region, product category).
How to Configure
Single Measure Line Chart
Example Data Structure
| the_date(Month) | store_type | store_sales |
|---|---|---|
| 1998-11 | Supermarket | 49606.44 |
| 1998-09 | Deluxe Supermarket | 47535.31 |
| 1998-04 | Deluxe Supermarket | 40525.14 |
| 1998-05 | Deluxe Supermarket | 39642.43 |
| 1998-04 | Supermarket | 35456.96 |
| 1998-07 | Supermarket | 33860.21 |
| 1998-11 | Gourmet Supermarket | 11314.79 |
| 1998-01 | Gourmet Supermarket | 9928.90 |
| 1998-01 | Mid-Size Grocery | 9188.15 |
| 1998-03 | Gourmet Supermarket | 9146.81 |
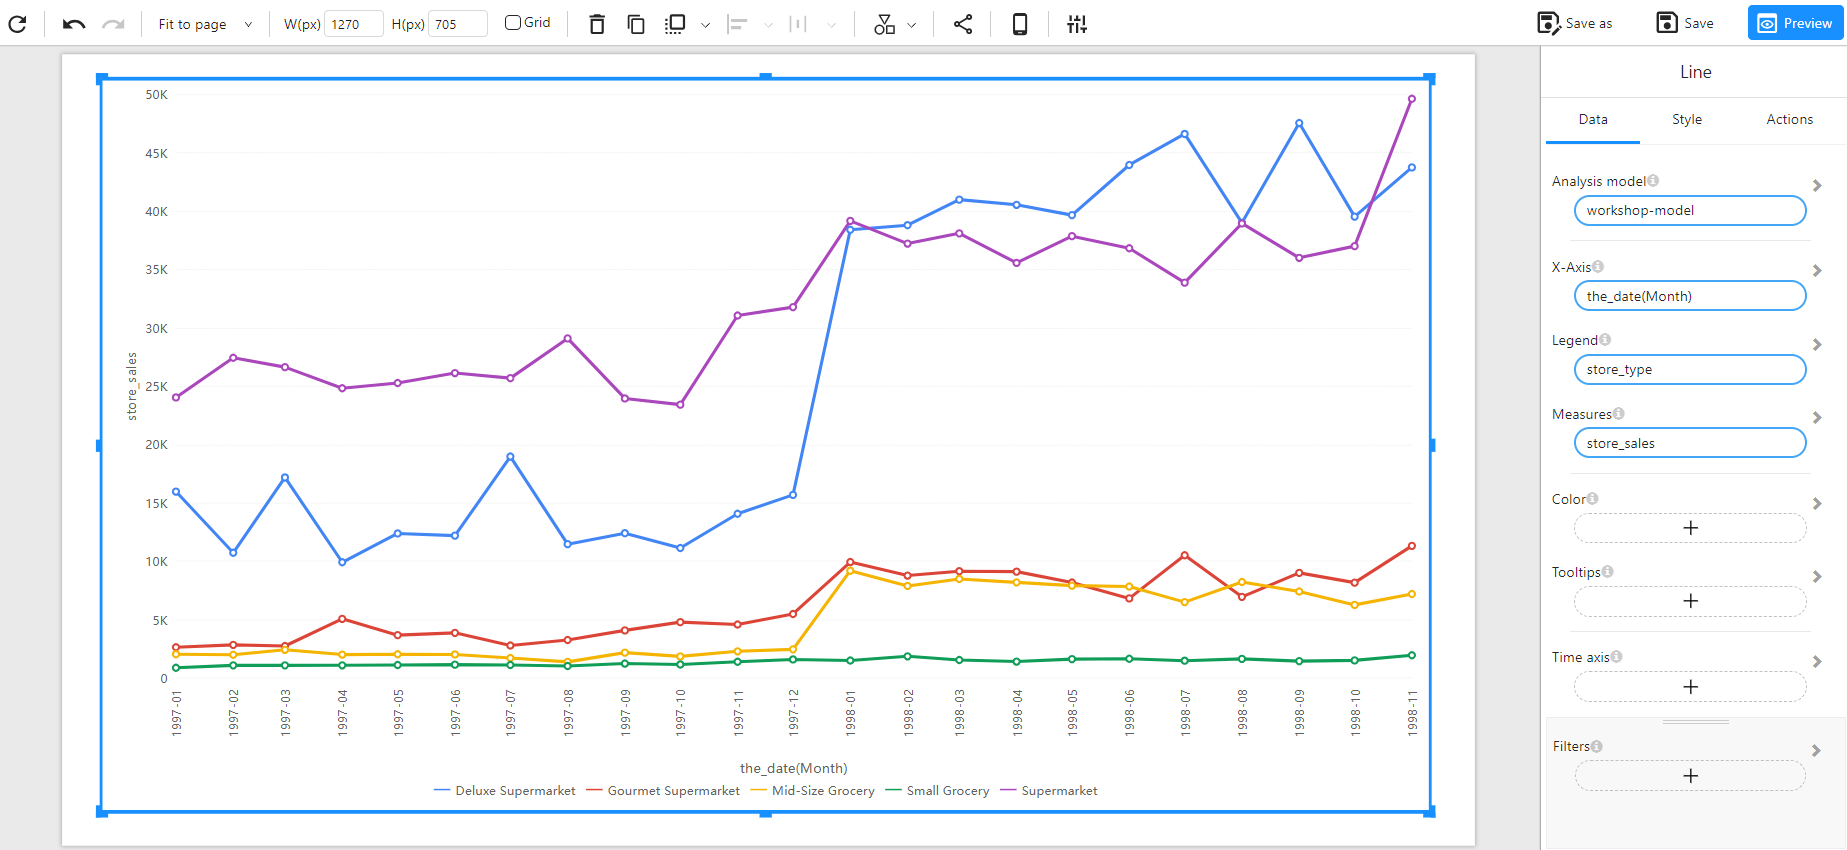
Example: The following example shows store sales trends across different store types.
Multiple Measure Line Chart
Example Data Structure
| the_date(Month) | store_sales | store_invoice | store_cost |
|---|---|---|---|
| 1998-11 | 113787.84 | 15911.64 | 45669.87 |
| 1998-09 | 101378.60 | 15141.37 | 40612.14 |
| 1998-07 | 98943.44 | 14918.34 | 39754.67 |
| 1998-03 | 98219.90 | 13997.53 | 39368.83 |
| 1998-01 | 98155.28 | 15148.30 | 39239.18 |
| 1998-06 | 97050.04 | 15433.66 | 38995.82 |
Example: The following example visualizes store sales, store invoice, and store cost over time.