
Appearance
v10.01 Release Notes
10.01 is the first release after 10.00 (October 22, 2026). This note covers every change since 10.00.
10.01 adds paginated reports, a new kind of report laid out on paper pages for printing, exporting and scheduled delivery, and a Lineage page that shows what depends on what across models, data sources and reports, and what breaks before you change something. In dashboard reports, the Action button becomes a plain button that passes the page's filters to the report it opens, relative dates can count from a Date component and pick the latest period that has data, and several problems reported after 10.00 are fixed.
Read Upgrade notes before you upgrade.
Highlights
1. Paginated reports
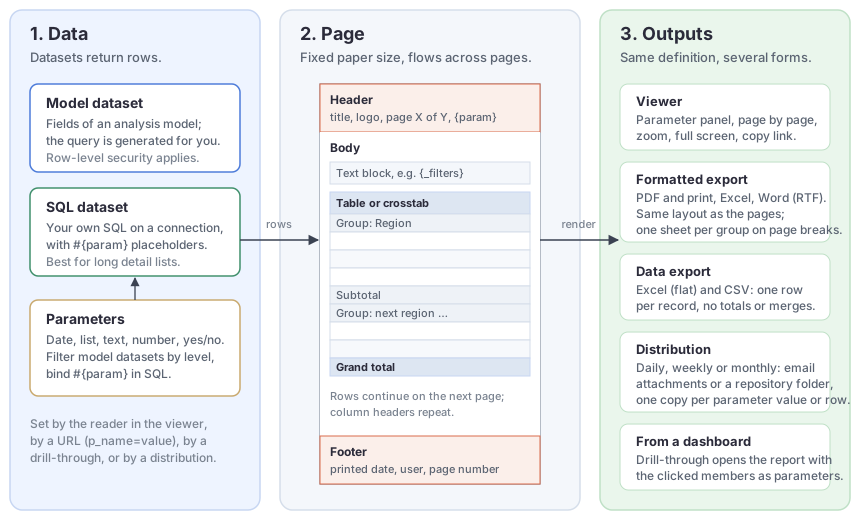
A paginated report (.pagereport) is a document: a fixed paper size, a header and footer on every page, and one table or crosstab that runs across as many pages as its rows need. Use it for monthly statements, long listings and signed-off PDFs, where a dashboard report is made for exploring on screen.
- Create with New › Paginated report in a console folder. A wizard builds a detail table, a grouped report or a crosstab in two steps; drag model fields to rows, columns and values.
- Data from an analysis model (row-level security applies) or your own SQL on a connection, with
#{parameter}placeholders bound as query parameters. Writing SQL needs raw SQL permission on the connection. - Parameters that readers set before the report runs: typed in, chosen from a list, taken from a global parameter or the signed-in user, defaulting to a relative date such as first day of last month, and cascading. A date parameter can be a date range.
- Tables and crosstabs with groups, subtotals, grand totals and the same style templates as dashboard tables; header and footer bands with text, images, page numbers and field values in a 3 × 3 grid.
- Viewer and exports: page through the report in the console or a new tab, print it, or export it to PDF, Excel, Word (RTF), flat Excel and CSV. Large exports run in the background and wait under My account › Report downloads.
- Distribution: run a report on a schedule or on demand, one copy per recipient or parameter value, and email it or save it to a repository folder.
- Drill through from a dashboard chart to a paginated report: the clicked members are mapped to the report's parameters.
Paginated reports are an optional plugin. See Limits in this release.
Understanding Paginated Reports · Creating a Paginated Report · Viewing, Pagination and Export · Distribution
2. Lineage
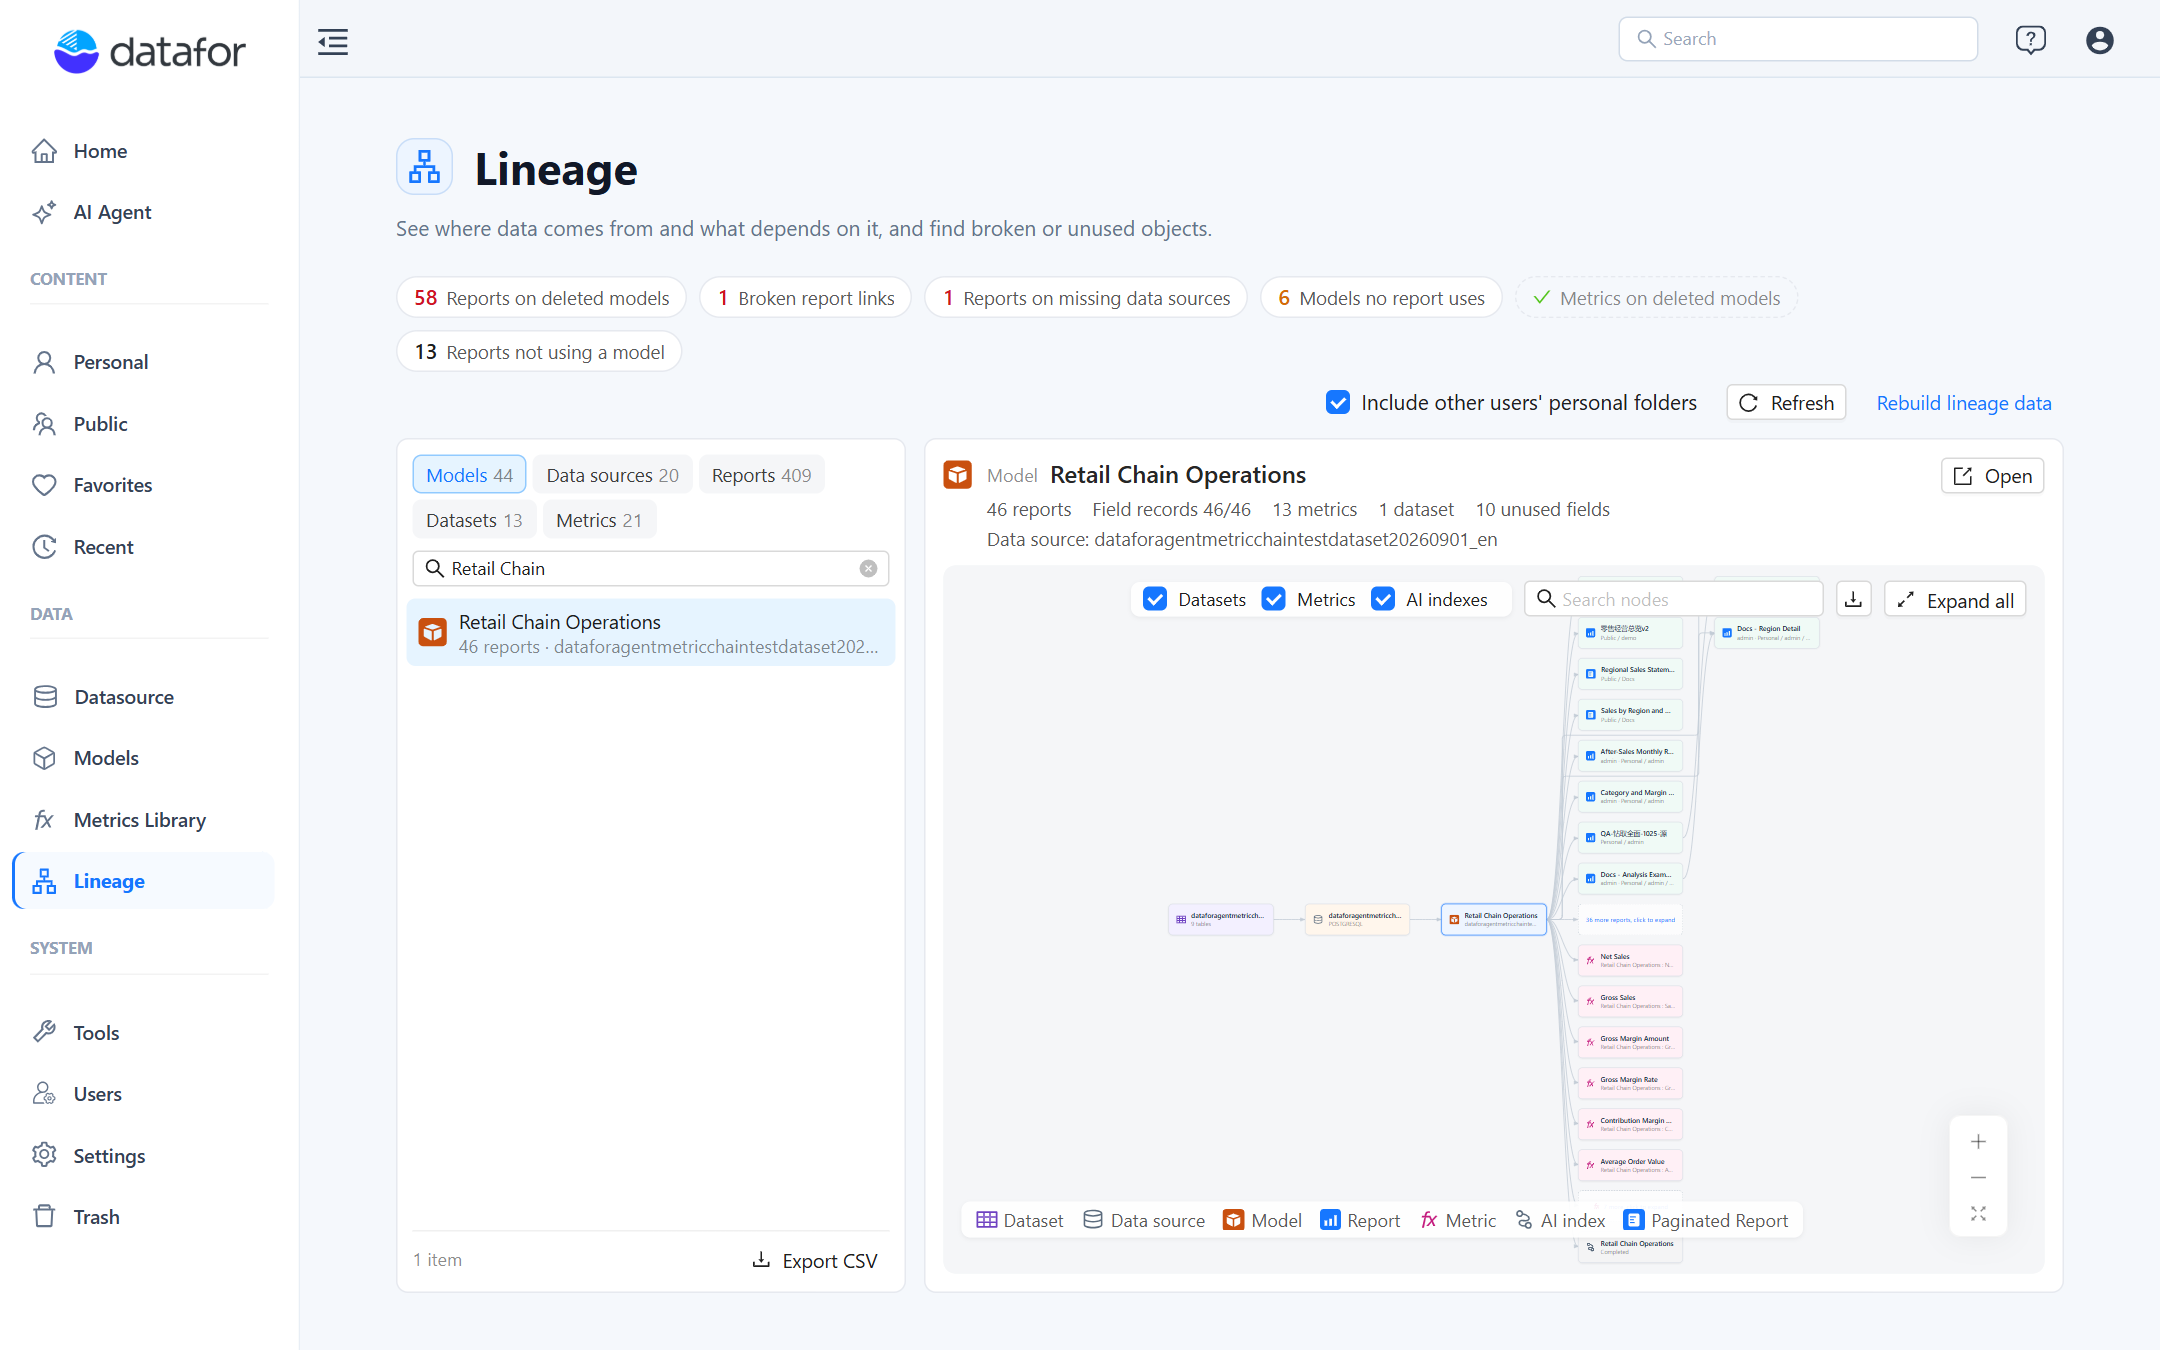
- Data › Lineage (new page) lists every model, data source, report, dataset and metric you can see. A health bar flags reports on deleted models, paginated reports on missing data sources, broken drill-through links, models no report uses and metrics on deleted models; click a chip to list the affected objects. Select an object for its details and a lineage graph centred on it. Lists export to CSV and graphs to PNG.
- Clean up from the page: move a report that uses a deleted model to Trash, or list all reports of a deleted model and move them to Trash one by one.
- Field-level usage: the modeler's Usage section shows which reports use a measure, level or calculated member, and delete or change confirmations list what will break.
- Report lineage in the report toolbar opens the graph of the open report. Graphs now include datasets, metrics, AI indexes and paginated reports.
- Rebuild lineage data (administrators): reports saved before the upgrade have no field-level record until it is run once.
Understanding Lineage · The Lineage Page · Usage and Impact Analysis
3. Action button and Go to report
- Action button is now a plain button without data binding: Fill, Outline, Text or Image style with Default, Hover, Pressed and Disabled states and icons, text with dynamic values, a Disable condition, and click actions such as opening a report page or link, switching tabs, resetting or clearing filters, exporting PDF, full screen and Open AI insight. Its click also runs in the editor, so you can try it while you design.
- Go to report on Text, Image, Icon, Shape and Action button passes the page's filters, the members clicked in charts and the report parameters to the target report: by matching field names, or with a target field (or Do not pass) for each page filter. This also works when the target opens in the current tab.
- Insert dynamic value is a {x} button at the end of the text box with a grouped menu, and inserts at the cursor.
{{filter.Field}}shows the members clicked in charts when no filter, or a filter set to All, covers that field.
Action button · Click Actions and Visibility
4. Relative dates
- Relative component filters that follow a Date component. A chart's Relative filter (Data → Filters) can count from today or from a Date component on the page: all of its range (the default), its start or its end. Include reference time keeps the window exactly N units long, calendar units add Include current period (for example the last 12 months including this one), and a month selected at Month granularity gives the same results as the same days selected as a range.
- Latest period. Dropdown, List box, Button group and Radio/Checkbox on a year, quarter, month, week or day field, and a single-period Date that filters by a field, can default to Latest period: the most recent period that has data, rather than the period that contains today. Periods that the date table holds in advance are skipped. It is looked up each time the report opens and on Refresh, so newly loaded data is picked up.
- Dates that travel across time zones. Fixed dates of a Date component are saved as calendar dates, so readers in other time zones see the dates the author chose.
Relative component filters · Latest period in list filters · Latest period in the Date component
5. Automatic mobile layout
- Reports without a mobile layout work on phones. Their components are arranged from the desktop page in reading order: the page title, then filters, small filters and cards two per row, charts, tables and maps at full width, the contents of Tabs in the same tabs. Components on the same background shape stay together, and shapes with text become labels; empty shapes and lines are left out. Earlier, phones showed the desktop page.
- The mobile designer starts from it. It opens with the generated layout on the canvas; adjust it and save. Auto layout in the header of Components rebuilds the layout from the desktop page at any time.
- Desktop page on phones is still possible: empty the phone canvas, for example with Clean all, and save.
Report editor
- Drill through: choosing the target report maps fields with the same name automatically; target fields are labelled Dimension › Hierarchy › Field. OK is blocked with a message when drill through is on but no report is chosen, a link has no address, or a pop-up has no size. Drill-through pop-ups open at a sensible default size.
- Pie charts at their default size are larger: outer labels get room by their actual angle and wrap to two lines before they are dropped.
- Switching tabs in reports with many components is faster.
- Measure filters accept
${parameter}as the threshold again, with a separate message when the parameter does not exist. - Drill-through filters bar: shown only when the target opens in the current tab or a new tab, not in a tooltip or pop-up.
- Linked components: a component added to the page is linked to every filter, also to filters whose list was edited or that cascade. Earlier, such filters left new components out.
- Reset and Clear on a Filter button write the value of a filter bound to a parameter back to the parameter, so formulas and other controls on it follow.
- A Numeric slider on a parameter sets a typed value outside its range to the nearest end.
- Conditions lists the selections of a Hierarchy table filter, shows numeric ranges as 10,000 ~ 39,696, and names fields passed in by a drill-through or Go to report by their captions.
- Empty components show only the message, without View conditions or Clear links buttons. Their toolbar now appears on hover as for any component, and Conditions lists the conditions and clears links. See Empty Data and Error Messages.
{{filter.Field}}and Go to report use the actual period for a Latest period default instead of the word last, and dates of a Date component as dates.- A Date component switched between Field and Time axis re-queries the affected components at once. In Time axis mode its default title is Date.
- Locked components are no longer moved by arrow keys, Align or Distribute.
- Table exports to Excel keep data bars; gradient colours and data bars include the Others row and column.
- A relative filter on a day field defaults to calendar days.
- Components on a deleted measure say that the field no longer exists, instead of Failed to load data with a Retry that cannot help.
Console, modeling and data sources
- Trash: restoring and emptying report a clear result. A file you cannot see is no longer reported as deleted, and permanently deleting a Trash item checks that it is yours to delete.
- Deleting a model is refused while reports you cannot see still use it.
- The Models list shows who created and who last modified each model; models from earlier versions show the last modifier as creator.
- SQL views in the modeler show the run result (rows, fields with types, sample rows) and errors inside the dialog. Editing an SQL view updates it in place instead of dropping and recreating it, which used to remove its joins, dimensions and measure groups; if the new SQL drops a column that is in use, you are asked first.
- Metrics Library: a metric still used in another metric's calculation relation cannot be deleted on its own (select both to delete them together); relations must point to existing metrics and cannot loop. Bindings follow model renames, saves and deletes. On a model you cannot open, a binding shows only the model, measure and comparison result; changing bindings, and generating metrics from a model, need write permission on it. Compare definition is disabled for a metric without a business definition. A new metric's owner defaults to you.
- Recent and Favorites in the console offer Edit only for reports you can edit.
- Opening a model that does not exist or that you cannot open says so instead of showing a script error.
- File imports that fail say which file and why.
- Error messages are worded consistently and no longer show low-level technical details.
- The update notice no longer shows a fixed brand name or download site.
Paginated reports and embedding
- PDF on a server without CJK fonts: Chinese text uses the standard PDF font STSong-Light, shown with the reader's own Song font, instead of turning into unreadable characters. See Fonts.
- Deleting a dataset that elements or parameters use says what uses it; an invalid parameter name says why it was refused. The Distribution list updates while a run is in progress.
- SDK: a drill-through or Action button that opens a report in the current tab calls
onRedirectEventwithreason: "drill", the passed values and URL parameters, instead of changing the host page's address. See onRedirectEvent. An error in a host callback no longer stops the report from loading.
AI Agent
- Dashboard insight has a Standard / Detailed switch. Detailed gives up to eight key insights, each with what it means, and a Chart by chart section; it takes longer. The choice is remembered in the browser, and results end with Generate detailed version or Switch to standard version. See Standard or detailed.
- Changing or deleting Frequently asked questions refreshes the welcome card at once.
- On Windows, the AI Agent starts from one launcher for all of its roles.
Upgrade notes
- Phones and reports without a mobile layout: phones now open such reports in an automatic mobile layout instead of the desktop page. To keep the desktop page for a report, open its mobile designer, click Clean all, and save. Tablets still open the desktop page.
- Action buttons bound to a model field in earlier reports keep working as Data button (legacy), which is no longer in the palette. An Action button without a bound field can be converted with Convert to Action button.
- Relative component filters may return a slightly different period: Include reference time covers exactly N units (one day fewer than before); a calendar unit is no longer moved by an include setting that was hidden for calendar units; a count of 0 counts as 1; and a filter that referenced a range Date without choosing its start or end now counts from the whole range.
- Fixed Date defaults saved in another time zone open on the dates the author chose instead of a day earlier or later. Save the report once to store them in the new format.
- List filters on a time field that defaulted to Last now show Latest period and pick the most recent period that has data, also when the field is sorted in descending order or by a measure. Earlier they picked the last member of the date table, which could be a month the date table holds in advance.
- Filters and charts added later: in reports saved before 10.01, a component added after a filter's Linked components or Cascade other filters was changed may not be filtered by it. Check those filters' Linked components.
- Metrics Library: deleting a metric that another metric's relation uses is now refused, and saving a model removes the bindings of measures it no longer has.
- Lineage: run Data › Lineage › Rebuild lineage data once as an administrator after the upgrade, so reports saved earlier take part in usage and impact lists.
- AI Agent shared secret: Datafor now reads it from
ai-agent/.env(orai-agent/instance-secrets.env) next tobi-server, not from<agent-secret>in the modeler plugin'ssettings.xml. Upgrade the modeler plugin and the AI Agent launch scripts together. If the AI Agent runs on another machine, setDATAFOR_AGENT_SECRETas an environment variable or-Ddatafor.agent.secretfor the Datafor server, then restart it; otherwise models configured in Datafor fail for non-administrators.
Important bug fixes
- Security: a share link opened as its creator could reach other files through the creator's identity; it now covers only viewing (and, for an editable link, saving) the shared report. Detail-row (MDX drill-through) queries now apply row-level security on restricted tables they do not otherwise use.
- Two filters on the same column, for example a Button group on Product Family and a Hierarchy table filter whose first level is Product Family, gave wrong totals: the later condition replaced the earlier one. Both now apply.
- Day filters on a connection with a database time zone no longer select the day before or after when the browser is in another time zone.
- On phones, a Time axis Date component that is not in the mobile layout no longer leaves charts empty.
- In the mobile designer, selecting in a Hierarchy table filter re-queries the charts at once.
- The report editor no longer times out on first open over a slow network, and reopening after a timeout needs no page reload.
- Calendar charts no longer stay blank when the server sends no raw date.
- Creating a measure from a table's Fields or filter area no longer hangs.
- A shared link no longer fails with no permission after a report it drills into or embeds is renamed or moved.
- Filtering a level on an integer column by name no longer fails.
- Clicking a field under Data → Filters works again after you switched to another component while a filter's details were open.
- A Hierarchy table filter's header alignment applies at once instead of after saving and reopening the report.
- Action scripts run again: Before data fetch on Dynamic image, chart click scripts on the new standard components, and the cell click script on Hierarchy table filters.