Component-Level Filtering
Datafor offers component-level filtering, allowing users to set specific filter conditions for each visualization component.
What is Component-Level Filtering?
Component-level filtering is a feature in Datafor that applies filters to individual visualization components. It enables users to set unique filter conditions for each component, affecting only the selected visualization without influencing other components on the page.
Why Use Component-Level Filtering?
There are several key benefits to using component-level filtering:
- Fine Control: Set different filter conditions for each visualization component to meet specific analytical needs.
- Enhanced Data Accuracy: Ensure that each component displays data that conforms to its unique filter conditions.
- Avoid Data Confusion: When displaying different dimensions or datasets on the same page, component-level filtering helps avoid data confusion.
How to Use Component-Level Filtering
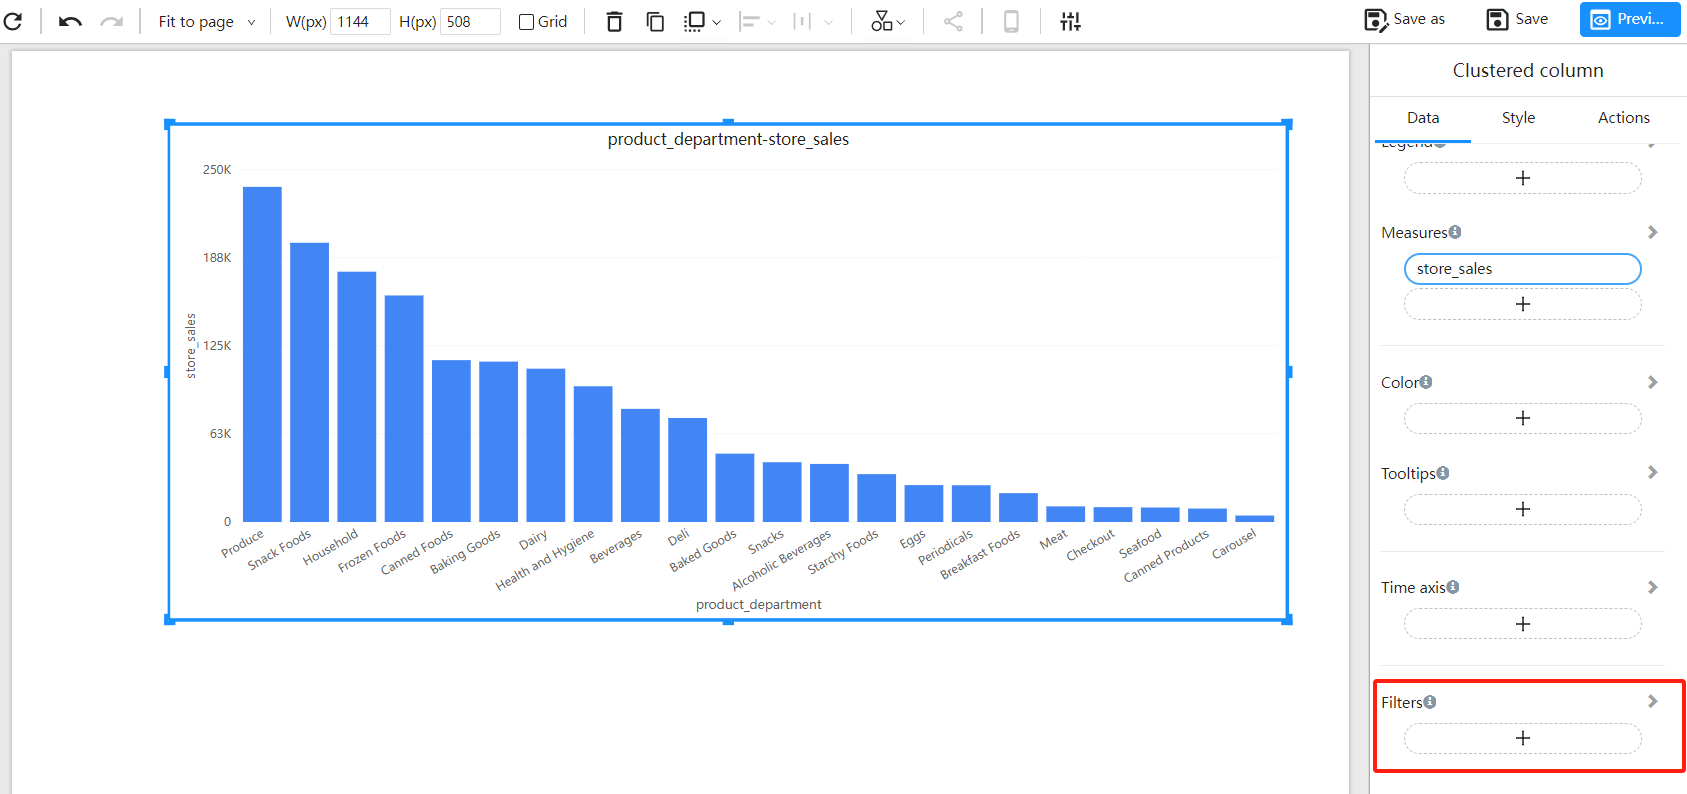
1. Select the Visualization Component and Locate the “Filter” Area in the Data Panel

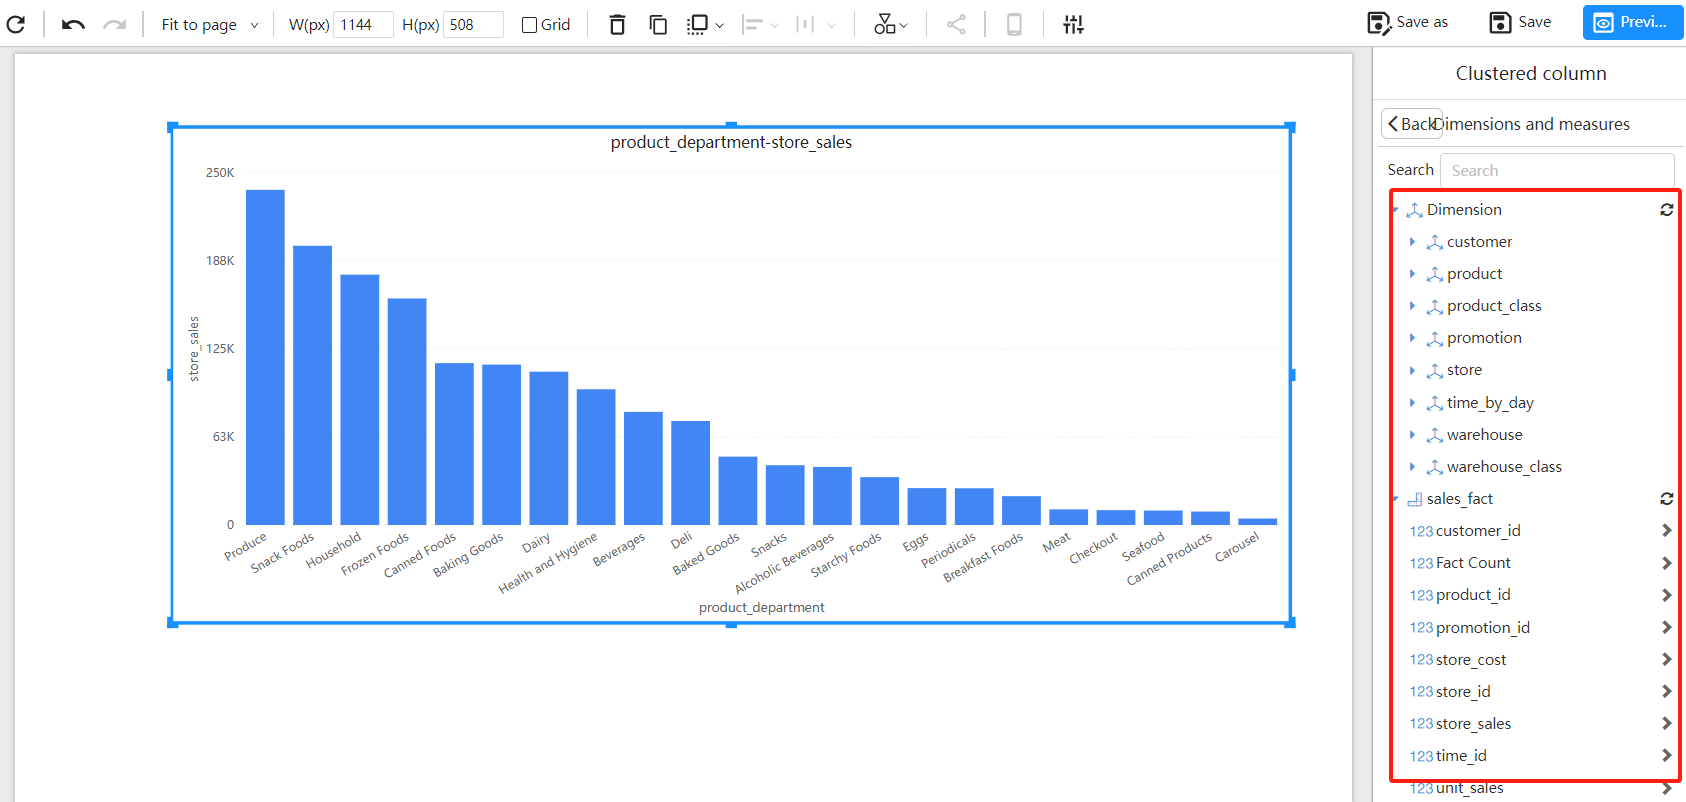
2. Add Filter Fields
Click the Add data button and select the field you want to use as a filter condition from the analysis model.

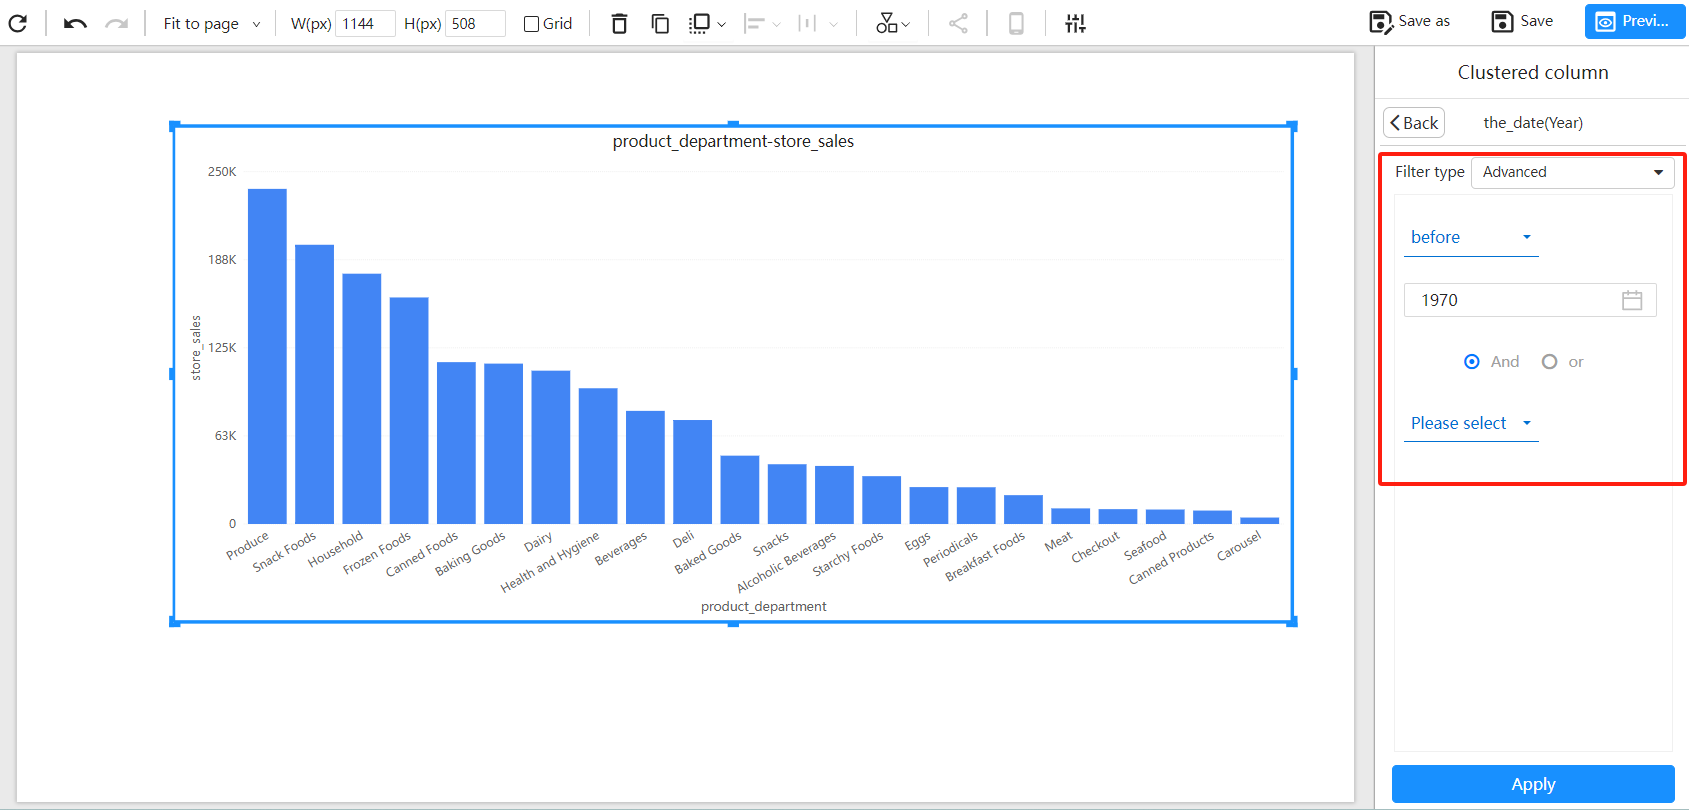
3. Configure Filter Conditions
After selecting the data field, you can configure the filter conditions as needed. For example, if you choose a date field, you can set a date range filter.

Filtering Methods for Different Field Types:
| Field Type | Filter Type | Filtering Methods |
|---|---|---|
| Text | Basic | Include or exclude |
| Advanced | Contains, does not contain, starts with, ends with | |
| Time | Basic | Include or exclude |
| Relative | Relative time, including: past, current, future | |
| Advanced | Before (<=), equals (=), after (>=) | |
| Numeric | Basic | Less than, less than or equal to, equal to, greater than or equal to, greater than, greater than and less than, greater than or equal to and less than, greater than and less than or equal to, greater than or equal to and less than or equal to, not empty, empty |
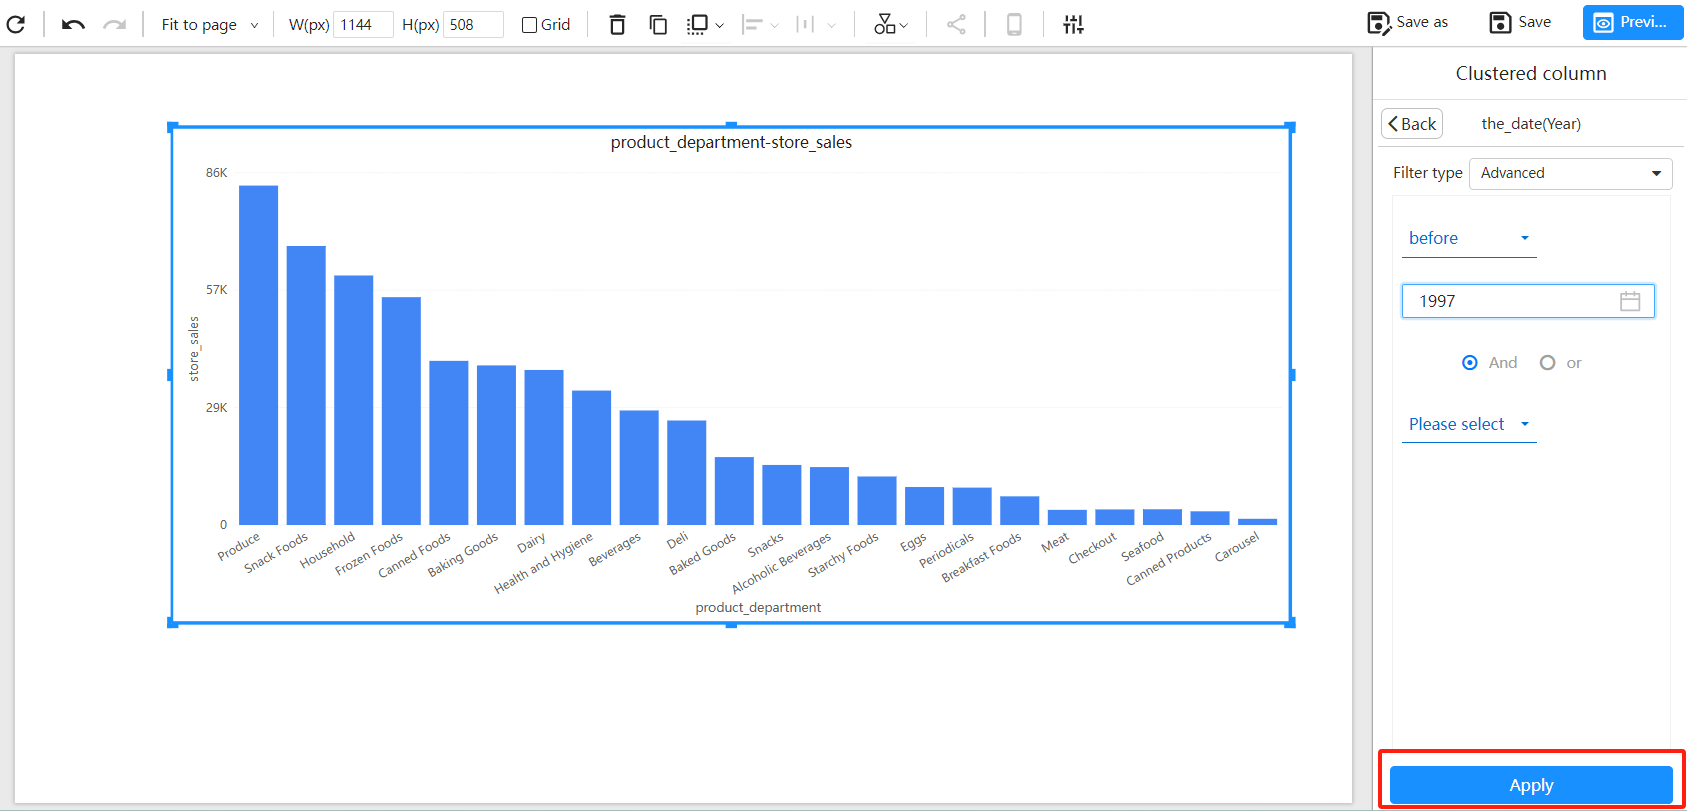
4. Apply the Filter and View the Effect
After configuring the filter conditions, click the Apply button to immediately apply the filter to the selected visualization component.

Conclusion
Datafor’s component-level filtering feature provides fine-grained data control for individual visualization components. It enhances data accessibility and interactivity while supporting complex analytical needs and personalized analysis experiences.