Datafor data visualization and analysis
Datafor is a self-service agile BI tool that provides intuitive and user-friendly data visualization and analysis capabilities to help users quickly explore, analyze, and make decisions with their data.
- It supports connecting and integrating with multiple data sources, allowing for real-time analysis and visualization of data.
- Without writing any code, users can quickly create various types of data visualizations and charts using simple operations such as dragging and clicking.
- It has powerful data analysis capabilities, supporting features such as data pivoting and multidimensional analysis, which can help users uncover patterns and insights behind their data and address business issues.
- It seamlessly integrates with other tools and platforms, providing users with data visualization and analysis support for all their business needs.
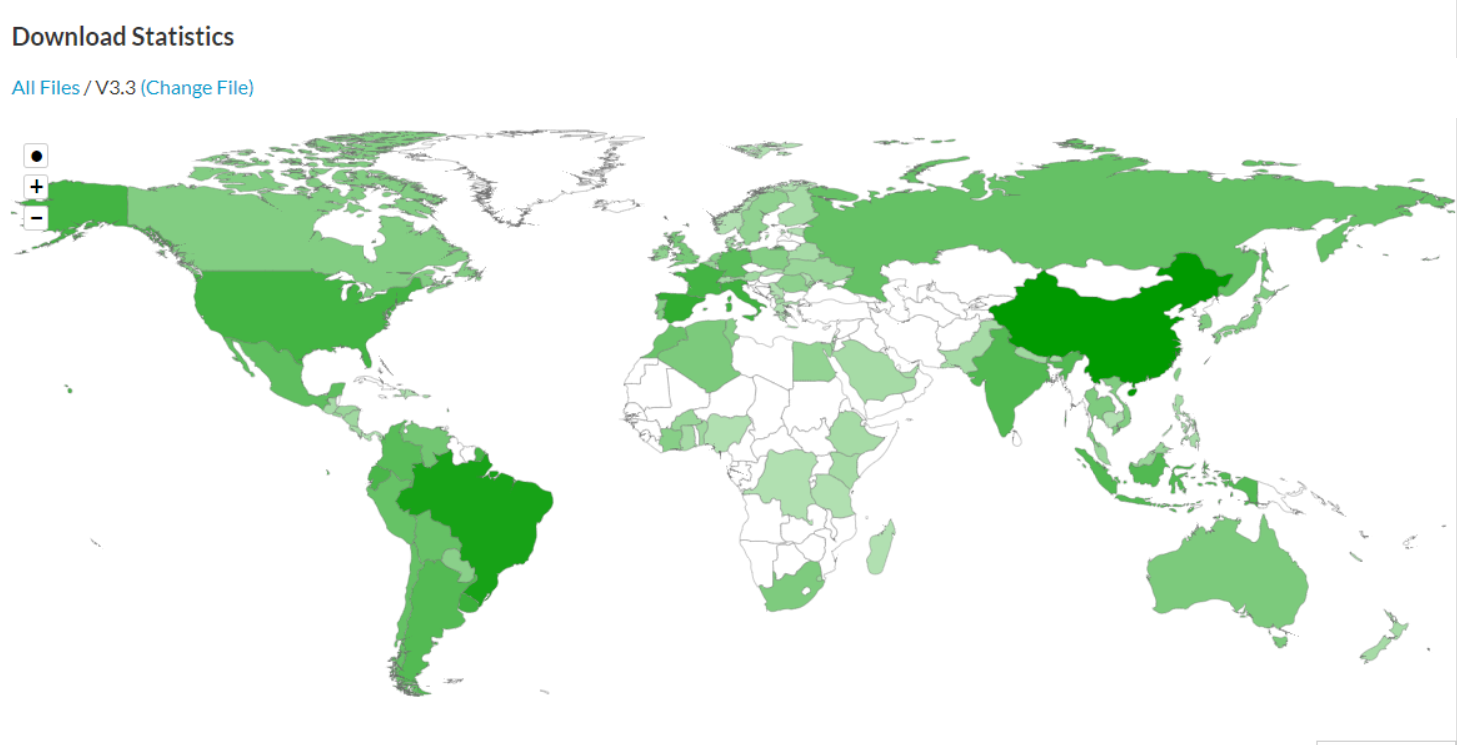
Downloaded and used in over 56 countries and regions
🚀This document is continuously updated...